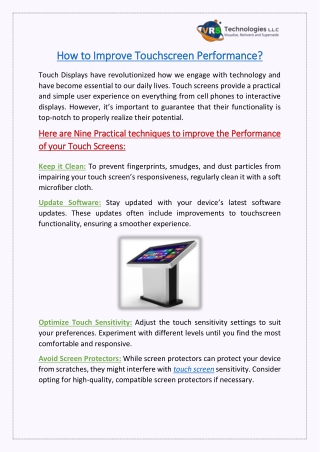
Reporting KPIs to improve performance
Reporting KPIs to improve performance. Presented by David Parmenter waymark solutions limited March 2010 Website: www.davidparmenter.com Email: Parmenter@waymark.co.nz. A ‘top ten’ performance management book on amazon.com for over two years. Amazon link on www.davidparmenter.com.

Reporting KPIs to improve performance
E N D
Presentation Transcript
Reporting KPIs to improve performance Presented by David Parmenter waymark solutions limited March 2010 Website: www.davidparmenter.com Email: Parmenter@waymark.co.nz
A ‘top ten’ performance management book on amazon.com for over two years Amazon link on www.davidparmenter.com
Are your performance measures improving performance? • our performance measures are not working – and we do not have a balanced scorecard • our performance measures are not working – we have a balanced scorecard approach • our performance measures areworking - and we do not have a balanced scorecard • our performance measures areworking - we have a balanced scorecard approach • cannot comment - do not know
How familiar are you with David Parmenter’s work? • first event, and no familiarity with his work • first live event, but have read his book • familiar with some of his web casts but not read his book • familiar with some of his web casts and his KPI book
How familiar are with the data visualization experts? • familiar with the work of Stephen Few and Edward R. Tufte • aware of authors but have not read their work • not heard of these authors / presenters
Who are your report designers – your data visualization experts? • a task left to the ‘young guns’ in the team responsible for the new report • normally left to the qualified accountants / IT specialists • all reports are reviewed by a design team who are familiar with the latest thoughts on visualization design • do not know
The ‘winning KPIs’ webcasts on www.bettermanagement.com • Introduction to winning KPIs (Aug 09) • Implementing KPIs - A 12-Step Process • Implementing KPIs in Smaller Orgs (<200 Staff) • Finding your organization’s critical success factors • Balanced scorecard in 16 weeks not 16 months • Getting started or restarted with winning KPIs • Revitalizing a floundering balanced scorecard with winning KPIs • ‘Winning KPIs’ – two question and answer sessions • “Sorting the wheat from the chaff – finding your wining KPIs • Reporting KPIs to improve performance
Common features of reporting performance measures (PMs) • low level or clarity of measures • many quarterly or further out e.g. annual staff satisfaction • same PMs reported to management and Board • little or no impact on the organisation e.g. does not stimulate action • many staff not aware of them / do not understand them • too many of them are financial
To report performance measures you need to: • understand your organisation’s CSFs – CFSs help you find your KPIs, determine what to report etc • realize that not all measures are KPIs • understand the concepts of Hoshin Kanri / balanced scorecard • the characteristics of ‘winning’ KPIs • understand the latest thinking on information visualization • understand the flaws of performance measure reporting applications
The hierarchy of success factors Timely arrival and departure of planes Critical success factors Success factors Next step see webcast ‘finding your organisation’s CSFs’
How strategy and the CSFs work together Organizations' Strategy Performance: Individuals /Teams / Divs Strategic initiatives Organisation CSFs New business created Business as usual: doing what we do every day better
Four types of performance measures KRIs peel the skin to find the PIs PIs&RIs peel to the core to find the KPIs KPIs
Hoshin Kanri / balanced scorecard Read: ‘Balanced scorecard and Hoshin Kanri: dynamic capabilities for managing strategic fit’ by Witcher and Chau http://www.uea.ac.uk/~mg597/downloads/papers/2007b.pdf
The characteristics of KPIs non financial measures (not expressed in Pds,$s etc) measured frequently e.g. daily or 24 by 7 acted upon by CEO and SMT clearly indicate what action is required by staff are measures that tie responsibility down to a team have a significant impact e.g. affects more than one CSF and BSC perspective they encourage appropriate action e.g. positive impact on performance Next step see webcast ‘Introduction to winning KPIs’
Top 4 sellers on information visualizationSource: Amazon • Information Dashboard Design: The Effective Visual Communication of Data by Stephen Few • Now You See It: Simple Visualization Techniques for Quantitative Analysis by Stephen Few • Show Me the Numbers: Designing Tables and Graphs to Enlighten by Stephen Few • The Visual Display of Quantitative Information by Edward R. Tufte
Stephen Few’s resources • Go to http://www.perceptualedge.com/library.php • I recommend: • common pitfalls in dashboard design • With Dashboards- formatting and layout definitely matter • Dashboard design for real-time situations awareness • Dashboard design for rich and rapid monitoring • www.perceptualedge.com/files/GraphDesignIQ.html and do his design test
#1: Exceeding the boundaries of a single screen Source: www.perceptualedge.com
#3: Displaying excessive detail or precision Source: www.perceptualedge.com
#5: Choosing inappropriate graphs Source: www.perceptualedge.com
#11: Cluttering the screen with useless decoration Source: www.perceptualedge.com
The common flaws in performance measure reporting applications • Applications designed by freshly minted MBAs • lack of grey hair (workface experience) • largely self taught • attracted by the latest ‘geek’ techno innovation • based on other applications that are also built by – FM MBAs • Lack understanding of the rules set out clearly by the thought leader Stephen Few • Matrix management – every thing is meant to neatly fit together – cascade down etc
The foundation stones of performance measure reporting • follow best practice display techniques • monthly reports never changed anything • reporting needs to reflect materiality – if annual sales are over $200m then YTD sales of $119,534,000 should be reported as $220m • measuring less is better (10/80/10 rule) • measures tested for behavioural impact before they are reported
The foundation stones of performance measure reporting #2 • measures linked to the CSFs of the organisation • do not let technology dominate over substance • suitable for the audience – do not give detail measures to the Board • use of the ‘Toyota A3’ page with graphs and commentary • report that is relevant and what is actionable to the reader • set graph standards for the whole organisation
My thoughts of graphs • be consistent - graph standards maintained for at least six months • show trend analysis - over at least the past 15 to 18 months • only year-to-date graphs should start off at the beginning of the year. • show the acceptable range - changing over time to indicate expected improvements. • keep graphs simple - clear even to an untrained eye (e.g., I question waterfall, radar, and three-dimensional graphs
My thoughts of graphs #2 • make them quick to update - in a system that enables swift updating (completed by day 3 post-month-end) • make them accessible key graphs should be accessible to all staff via the intranet • do not show a budget line – it is an arbitrary apportionment of the annual plan • show key turning points - insert notes on the graphs explaining major turning points. • insert a title that is meaningful to the reader - “Return on capital employed (ROCE) is recovering”
My thoughts of graphs #3 • use color wisely - I use a light-yellow background and to use color to highlight what is important • use gridlines - four or five light-gray gridlines will enable the reader to estimate the numbers • established for red, amber, green • if over 10% of target and over $xxx then red or green • if within 10% and over $xxxx then amber if negative • every report should have a commentary – in bullet points
24 by 7 reporting • intranet based • contact details of follow-up by CEO, SMT etc. • enough details for staff and management to action
Weekly reporting of top 5 KPIs to the SMT • could be something very simple in word • often best to wait before you buy an application • enough details for CEO, SMT to action
Sales dashboard by Stephen Few 30 Source: www.perceptualedge.com
Reporting team performance measuresScorecard of an IS function
Icon report to staff • could be something very simple in word • icons used instead of numbers • could use CSFs instead of BSC perspectives
Monthly summary of operations Daily / weekly KPI reports Monthly Team scorecards Minister/Board SMT/ Ops weekly Teams SMT SMT/ Ops daily Weekly Team rpt Staff
Suggested next steps • listen to my earlier webcasts and read my articles on www.bettermanagement.com • acquire my whitepapers and templates from www.davidparmenter.com • buy the book “Key Performance Indicators – developing, implementing and using winning KPIs” • access Stephen Few’s work (articles, papers, books) • link with an external expert to find your orgnaisation’s CSFs workshop
John Wiley & Sons have published Amazon link on www.davidparmenter.com
John Wiley & Sons have published Amazon link on www.davidparmenter.com