Linear Programming
Linear Programming. A Production Problem. Weekly supply of raw materials:. 8 Small Bricks. 6 Large Bricks. Products:. Table Chair Profit = $20/Table Profit = $15/Chair. Linear Programming.


Linear Programming
E N D
Presentation Transcript
A Production Problem Weekly supply of raw materials: 8 Small Bricks 6 Large Bricks Products: Table Chair Profit = $20/Table Profit = $15/Chair
Linear Programming Linear programming uses a mathematical model to find the best allocation of scarce resources to various activities so as to maximize profit or minimize cost.
Tables 15 * (2 chairs) + 20 * (2 Tables) = $ 70.00 Chairs 0 15 * (2 chairs) + 20 * (0 Tables) = $ 30.00
Components of a Linear Program • Decision variables • Changing cells • Objective function • Target cell • Constraints
Four Assumptions of Linear Programming • Linearity • Divisibility • Certainty • Nonnegativity
Why Use Linear Programming? • Linear programs are easy (efficient) to solve • The best (optimal) solution is guaranteed to be found (if it exists) • Useful sensitivity analysis information is generated • Many problems are essentially linear
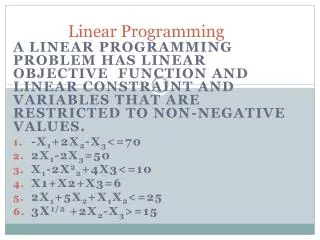
Mathematical Statement of aLinear Programming Problem In symbolic form, the linear programming model is: Choose values of the decision variablesx1, x2, … , xn to for known parametersc1, … , cn ; a11, … , amn ; b1, … , bm.
The Graphical Method for Solving Linear Programs • Formulate the problem as a linear program • Plot the constraints • Identify the feasible region • Draw an imaginary line parallel to the objective function (Z=a) • Find the optimal solution
Solving Linear Programs with Excel • Enter the input data and construct relationships among data elements in a readable, easy to understand way. Include: • the quantity you wish to maximize or minimize --- target cell • every decision variable – changing cells • every quantity that you might want to constrain (include both sides of the constraint) • If you don’t have any particular initial values you want to enter for your decision variables, you can start by just entering a value of 0 in each decision variable cell.
The formulas in the spreadsheet are shown below. Note the use of the SUMPRODUCT function. For linear programming you should try to always use the SUMPRODUCT function (or SUM) for the objective function and constraints, as this guarantees that the equations will be linear.
Defining the Target Cell (Objective Function) To select the cell you wish to optimize, select the “Set Target Cell” window within the Solver dialogue box, and then either • click on the cell you wish to optimize, or • type the address of the cell you wish to optimize (or enter the “name”). • Choose either “Max” or “Min” depending on whether the objective is to maximize or minimize the target cell.
Note: • The target cell must be a single cell (there can only be one objective) • The target cell should contain an equation that defines the objective and depends on the decision variables
Identifying the Changing Cells (Decision Variables) You next tell Excel which cells are decision variables—i.e., which cells Excel is allowed to change when trying to optimize. Move the cursor to the “By Changing Cells” window, and either • drag the cursor across all cells you wish to treat as decision variables, or • type the addresses of every cell you wish to treat as a decision variable, separating them by commas. (or enter the “name”)
If you wish to use the “dragging” method, but the decision variables do not all lie in a connected rectangle in the spreadsheet, you can “drag” them in one group at a time: • drag the cursor across one group of decision variables, • put a comma after that group in the “By Changing Cells” window, • drag the cursor across the next group of decision variables, • etc.... 2-22
Adding Constraints • To begin entering constraints, click on the “Add” button to the right of the constraints window. A new dialogue box will appear. The cursor will be in the “Cell Reference” window within this dialogue box. • Click on the cell that contains the quantity you want to constrain, or • type the cell address that contains the quantity you want to constrain. • The default inequality that first appears for a constraint is “<= ”. To change this, • click on the arrow beside the “<= ” sign. • Select the inequality (or equality) you wish from the list provided. • Notice that you may also force a decision variable to be an integer or binary (i.e., • either 0 or 1) using this window. We will use this feature later in the course. • After setting the inequality, move the cursor to the “Constraint” window. • Click on the cell you want to use as the constraining value for that constraint, or • type the number or the cell reference you want to use as the constraining value for that constraint, or • type a number that you want to use as the constraining value.
You may define a set of like constraints (e.g., all <= constraints, or all >= constraints) in one step if they are in adjacent rows (as was done here). Simply select the range of cells for the set of constraints in both the “Cell Reference” and “Constraint” window. • After you are satisfied with the constraint(s), • click the “Add” button if you want to add another constraint, or • click the “OK” button if you want to go back to the original dialogue box. 2-24
Some Important Options . Once you are satisfied with the optimization model you have input, there is one more very important step. Click on the “Options” button in the Solver dialogue box, and click in both the “Assume Linear Model” and the “Assume Non-Negative” box.
The Solution • After setting up the model, and selecting the appropriate options, it is time to click “Solve”. When it is done, you will receive one of four messages: • “Solver found a solution. All constraints and optimality conditions are satisfied”. This means that Solver has found the optimal solution. • “Cell values did not converge”. This means that the objective function can be improved to infinity. You may have forgotten a constraint (perhaps the non-negativity constraints) or made a mistake in a formula. • “Solver could not find a feasible solution”. This means that Solver could not find a feasible solution to the constraints you entered. You may have made a mistake in typing the constraints or in entering a formula in your spreadsheet. • “Conditions for Assume Linear Model not satisfied”. You may have included a formula in your model that is nonlinear. There is also a slim chance that Solver has made an error. (This bug shows up occasionally.)
If Solver finds an optimal solution, you have some options. > First, you must choose whether you want Solver to keep the optimal values in the spreadsheet (you usually want this one) or go back to the original numbers you typed in.> Click the appropriate box to make you selection. you also get to choose what kind of reports you want. For our class, you will often want to select “Sensitivity Report”.> Once you have made your selections, click on “OK”. To view the sensitivity report, click on the “Sensitivity Report” tab in the lower-left-hand corner of the window. 2-27
Properties of Linear Programming Solutions 1. An optimal solution must lie on the boundary of the feasible region. 2. There are exactly four possible outcomes of linear programming: a. A unique optimal solution is found. b. An infinite number of optimal solutions exist. c. No feasible solutions exist. d. The objective function is unbounded (there is no optimal solution). 3. If an LP model has one optimal solution, it must be at a corner point. 4. If an LP model has many optimal solutions, at least two of these optimal solutions are at corner points.
The Simplex Method The simplex method algorithm: 1) Start at a feasible corner point (often the origin). 2) Check if adjacent corner points improve the objective function: a) If so, move to adjacent corner and repeat step 2. b) If not, current corner point is optimal. Stop.
Linear Programming Formulations and Applications
Steps in Formulating a Linear Programming Problem • 1. What decisions need to be made? Define the decision variables. • 2. What is the goal of the problem? Write down the objective function. • 3. What resources are in short supply and/or what requirements must be met? Formulate the constraints. • Some Examples: • Product Mix • Diet / Blending • Scheduling • Transportation / Distribution • Assignment • Portfolio Selection (Quadratic)
LP Example #1 (Product Mix) The Quality Furniture Corporation produces benches and picnic tables. The firm has two main resources: its labor force and a supply of redwood for use in the furniture. During the next production period, 1200 labor hours are available under a union agreement. The firm also has a stock of 5000 pounds of quality redwood. Each bench that Quality Furniture produces requires 4 labor hours and 10 pounds of redwood; each picnic table takes 7 labor hours and 35 pounds of redwood. Completed benches yield a profit of $9 each, and tables a profit of $20 each. What product mix will maximize the total profit? Formulate this problem as a linear programming model. Let B = number of benches to produce T = number of tables to produce Maximize Profit = ($9)B +($20)T subject to Labor: 4B + 7T ≤ 1200hours Wood:10B + 35T ≤ 5000 pounds and B ≥ 0, T ≥ 0. We will now solve this LP model using the Excel Solver.
Spreadsheet Solution of LP Example #1 Other Related Examples:
LP Example #2 (Diet Problem) Na vy O r a ng e s M inimum M ilk B e a n s ( l a rg e Ca lif . Da ily (g a llon s ) ( c up s ) Va len c i a ) R equ i r e men t N i a c i n ( m g) 3 . 2 4 . 9 0 . 8 13 . 0 Th i am i n (mg ) 1 . 12 1 . 3 0 . 19 1 . 5 V it a min C (mg ) 32 . 0 0 . 0 93 . 0 45 . 0 C ost ($ ) 2 . 00 0 . 20 0 . 25 A prison is trying to decide what to feed its prisoners. They would like to offer some combination of milk, beans, and oranges. Their goal is to minimize cost, subject to meeting the minimum nutritional requirements imposed by law. The cost and nutritional content of each food, along with the minimum nutritional requirements are shown below.
Spreadsheet Solution of LP Example #2 Other Related Examples:
LP Example #3 (Scheduling Problem) N umbe r o f T i me P er iod Off ic er s N e eded 12 a. m . - 4 a. m . 11 4 a. m . - 8 a. m . 15 8 a. m . - 12 p.m . 31 12 p.m . - 4 p . m . 17 4 p.m . - 8 p . m . 25 8 p.m . - 12 a .m . 19 An airline reservations office is open to take reservations by telephone 24 hours per day, Monday through Friday.The number of reservation agents needed for each time period is shown below. The union contract requires all employees to work 8 consecutive hours. Goal: Hire the minimum number of reservation agents needed to cover all shifts.
Spreadsheet Solution of LP Example #3 Other Related Examples:
Workforce Scheduling at United Airlines • United employs 5,000 reservation and customer service agents. • Some part-time (2-8 hour shifts), some full-time (8-10 hour shifts). • Workload varies greatly over day. • Modeled problem as LP: • Decision variables: how many employees of each shift length should begin at each potential start time (half-hour intervals). • Constraints: minimum required employees for each half-hour. • Objective: minimize cost. • Saved United about $6 million annually, improved customer service, still in use today. For more details, see Jan-Feb 1986 Interfaces article “United Airlines Station Manpower Planning System”, available for download at www.mhhe.com/hillier2e/articles
Super Grain Corp. Advertising-Mix Problem • Goal: Design the promotional campaign for Crunchy Start. • The three most effective advertising media for this product are • Television commercials on Saturday morning programs for children. • Advertisements in food and family-oriented magazines. • Advertisements in Sunday supplements of major newspapers. • The limited resources in the problem are • Advertising budget ($4 million). • Planning budget ($1 million). • TV commercial spots available (5). • The objective will be measured in terms of the expected number of exposures. Question: At what level should they advertise Crunchy Start in each of the three media?
Cost and Exposure Data Note: No more than 5 TV commercials allowed
LP Example #4 (Transportation Problem) A company has two plants producing a certain product that is to be shipped to three distribution centers. The unit production costs are the same at the two plants, and the shipping cost per unit is shown below. Shipments are made once per week. During each week, each plant produces at most 60 units and each distribution center needs at least 40 units. Question: How many units should be shipped from each plant to each distribution center?
Distribution System at Proctor and Gamble • Proctor and Gamble needed to consolidate and re-design their North American distribution system in the early 1990’s. • 50 product categories • 60 plants • 15 distribution centers • 1000 customer zones • Solved many transportation problems (one for each product category). • Goal: find best distribution plan, which plants to keep open, etc. • Closed many plants and distribution centers, and optimized their product sourcing and distribution location. • Implemented in 1996. Saved $200 million per year. For more details, see 1997 Jan-Feb Interfaces article, “Blending OR/MS, Judgement, and GIS: Restructuring P&G’s Supply Chain”, downloadable at www.mhhe.com/hillier2e/articles
LP Example #5 (Assignment Problem) The coach of a swim team needs to assign swimmers to a 200-yard medley relay team (four swimmers, each swims 50 yards of one of the four strokes). Since most of the best swimmers are very fast in more than one stroke, it is not clear which swimmer should be assigned to each of the four strokes. The five fastest swimmers and their best times (in seconds) they have achieved in each of the strokes (for 50 yards) are shown below. Question: How should the swimmers be assigned to make the fastest relay team?