Download
1 / 17
240 likes | 747 Views
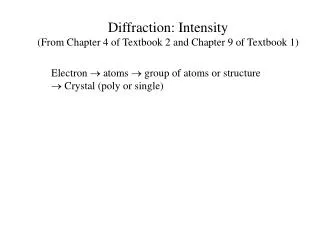
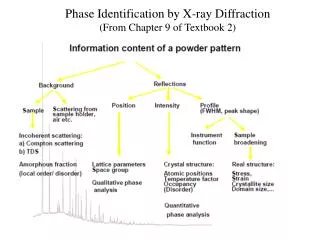
Phase Identification by X-ray Diffraction (From Chapter 9 of Textbook 2). Powder Diffraction Methods • Qualitative Analysis – Phase Identification • Quantitative Analysis – Lattice Parameter Determination – Phase Fraction Analysis • Structure Refinement – Rietveld Methods

E N D
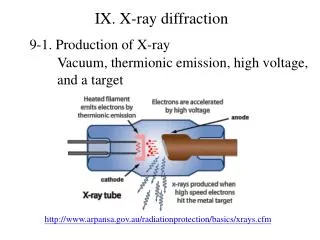
Phase Identification by X-ray Diffraction (From Chapter 9 of Textbook 2)
Powder Diffraction Methods • Qualitative Analysis – Phase Identification • Quantitative Analysis – Lattice Parameter Determination – Phase Fraction Analysis • Structure Refinement – Rietveld Methods • Structure Solution – Reciprocal Space Methods – Real Space Methods • Peak Shape Analysis – Crystallite Size Distribution – Microstrain Analysis – Extended Defect Concentration
1930’s Hanawalt, Rinn and Frevel(Dow Chemical): diffraction data on about 1000 compounds JCPDS, ICDD: Joint Committee on Powder Diffraction Standards; 1978 was renamed International Center for Diffraction Data. HanawaltMethod: (Grouping scheme) values of the three strongest lines (d1, d2, d3) and intensities (I/I1)
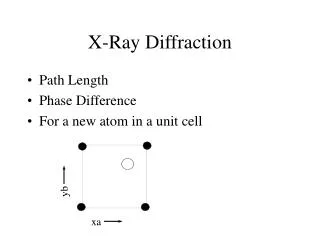
three strongest lines File number lowest-angle line Chemical formula and name of substance Special symbol data on diffraction method used crystallographic data optical and other data data on specimen diffraction pattern
Special symbols give extra information: *: well-characterized chemistry, quantitative measure of intensity, high-quality d-spacing data (3 to 4 significant digits, no serious systematic errors) i: reasonable range and even spread of intensity, “sensible” completeness of the pattern, good d-spacing data (3 significant digits) o: low precision data, possible multi-phase mixture, possible poor chemical characterization c: powder pattern calculated from structural parameters
Procedure (1) Locate proper d1group (2) Find the closest match to d2 (±0.01 Å) (3) Follow by matching d3 (4) Compare relative intensity (5) Good agreement in search manual locate the proper PDF card compare the d and I/I1values of all the peaks
Examples: unknown pattern from measurement: strongest lines in the powder pattern: d1 = 2.82; d2= 1.99; d3= 1.63
Portion of the ICDD Hanawalt search manual: d1 = 2.82; d2 = 1.99; d3 = 1.63 Matched, turn to card number 5-628
Very weak K (220) plane higher Intensity? Absorption effect Discrepancies!! 2×2.18×sin = 1.54 = 20.68o 2×d×sin 20.68o = 1.392 d = 1.97 Not listed
Identification of Phases in Mixtures Examples: pattern of unknown d: 3.01 2.47 2.13 2.09 1.80 1.50 1.29 1.28 I/I1: 5 72 28 100 52 20 9 18 d: 1.22 1.08 1.04 0.98 0.91 0.83 0.81 I/I1: 4 20 3 5 4 8 10 No substance matching (d1:2.09; d2:2.47; d3: 1.80) all together probably a mixture Assume: d1 and d2not the same phase. d1and d3the same phase find Cu Check the Pattern of Cu: d: 2.088 1.808 1.278 1.090 1.044 0.904 0.830 0.808 I/I1: 100 46 20 17 5 3 9 8
Remainder of pattern of unknown: d: 3.01 2.47 2.13 1.50 1.29 1.28 0.98 I/I1: 5 72 28 20 9 4 5 I/I1: 7 100 39 28 13 6 7 Normalized Following the steps of searching again Cu2O
Overlapped diffraction lines carefully subtract the intensity from the already identified phases to help further identification of other phases. Example
Computer searching of the PDF: Computerization has dramatically improved the efficiency of searching the JCPDS database Cards are no longer printed –data are on CD-ROM Numerous third-party vendors have software for searching the PDF database Computerized “cards” can contain much more crystallographic information Database is still expanding … New approach – whole pattern fitting
Special symbol
Searching of the PDF requires high-quality data Accurate line positions are a must! Calibrationof camera and diffractometerwith standards Carefulmeasurement of line intensities Eliminationof artifacts (e.g. preferred orientation) Solidsolutions and strains shift peak positions “Garbagein, garbage out” Errorsin database
EVA software TOPAS software