Download
1 / 23
230 likes | 362 Views
The DEEP2 Galaxy Redshift Survey utilizes the DEIMOS spectrograph on the Keck II telescope to investigate galaxy properties and large-scale structure at redshift z=1. This study focuses on the potential evolution of the Fine Structure Constant (α), a fundamental constant of nature, over time. Utilizing a unique galaxy sample, this research aims to measure the wavelengths of [OIII] emissions, providing a precise test for variations in α. Preliminary results indicate no significant changes in α from z~0 to z~0.7, suggesting stability in this fundamental constant.

E N D
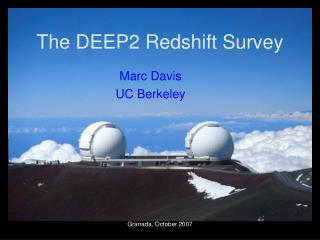
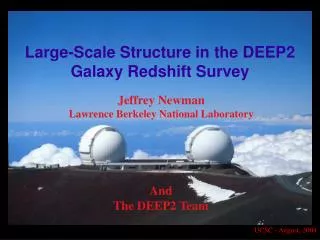
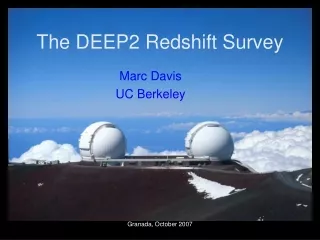
Testing for Evolution in the Fine Structure Constant with DEEP2 Jeffrey Newman Lawrence Berkeley National Laboratory And The DEEP2 Team
The DEEP2 Galaxy Redshift Survey, which uses the DEIMOS spectrograph on the Keck II telescope, is studying both galaxy properties and large-scale structure at z=1. The DEEP2 Collaboration U.C. Santa Cruz S. Faber (Co-PI) D. Koo P. Guhathakurta D. Phillips C. Willmer B. Weiner R. Schiavon K. Noeske A. Metevier L. Lin N. Konidaris G. Graves JPL P. Eisenhardt Princeton D. Finkbeiner U. Pitt. A. Connolly K survey (Caltech) K. Bundy C. Conselice R. Ellis U.C. Berkeley M. Davis (PI) A. Coil M. Cooper B. Gerke R. Yan C. Conroy LBNL J. Newman U. Hawaii N. Kaiser
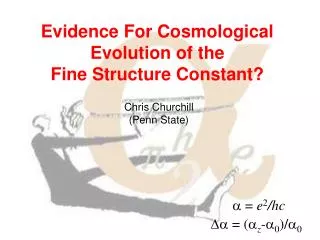
Do the fundamental constants of Nature change over time? DEEP2 data can be used to answer questions not considered when the survey was designed. For instance, we are now testing for evolution in the Fine Structure Constant, . • Time evolution of is predicted by some dark energy scenarios and some theories with extra dimensions. • There have been recent claims of significant evolution based on QSO absorption-line systems. • Most methods of testing for evolution in are likely dominated by unknown systematics (e.g. different groups get significantly different results).
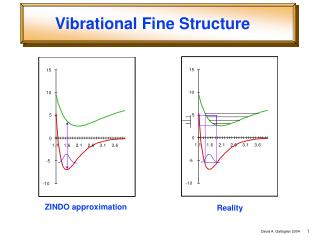
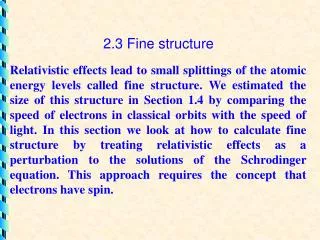
a and [OIII] The separation of the [OIII] 4959/5007 doublet lines provides a particularly clean test for evolution in a - both lines are emitted from the same energy level. Bahcall et al. recently used [OIII] from SDSS quasars to test for evolution in a. 5% change in a To <~1%, a2 (l2-l1)/(l2+l1) for these lines, as the splitting arises from fine structure directly.
Measuring with DEEP2 The DEEP2 sample is unique in using galaxies, rather than QSOs/AGN, to measure [OIII] wavelengths. Advantages of DEEP2 for this work include: • High spectral resolution compared to SDSS sample (0.3 Å/pix). • Attendant tighter control of wavelength solution. Systematics are <0.001Å differential between the two [OIII] lines. • Larger sample than SDSS DR1 QSOs (123-844 galaxies vs. 23-308 QSOs), allowing better tests of errors. • Higher typical redshift (median z=0.72 vs 0.37; [OIII] is present in DEEP2 spectra from 0.28<z<0.80). • Main disadvantage is lower S/N for each individual object - so we beat everything down by sqrt(N).
Tying down the wavelength solution It is critical to fix the l solution at the time of observation (as opposed to when calibrations are taken). Using night sky lines, we are able to remove low-order instrument changes to better than ~0.008 Å RMS (fitting >100 slits per mask). Distribution of residuals with and without corrections
Looking for changes in a from z=0 Start with the simplest thing: combine all data with z>0.6 into one bin, and measure <Da2>. Newman et al. 2005, in prep
Results - checking for an offset Results are very consistent with no evolution in a from z=0. We can perturb many of the ways we do things (e.g. use Hb for redshifts instead of the full spectrum, or change the wavelength calibration of template sky spectrum) and this remains true.
Results - exploring da/dt Null hypothesis (no evolution from z=0) has very good c2 (p ~ 80%). Adding 1 or 2 parameters only improves c2 marginally.
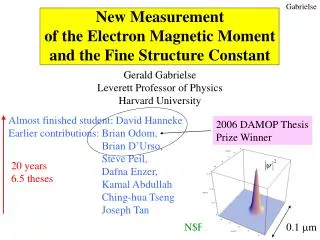
Vs. previous measurements Nominal precision still does not approach QSO absorption-line measurements. However, method is much more simple (and robust?).
Some conclusions • Our results are consistent with no evolution in the fine structure constant from z~0 to z~0.7. • Large surveys can make possible many kinds of scientific discoveries, and go far beyond whatever topics and fields are thought to be interesting when the survey is designed. • Future baryonic oscillation surveys may be able to do very well at constraining evolution in , if they have the resolution and right wavelength coverage; they will have large samples of bright, star-forming galaxies at z~1. 100x larger samples may be feasible.
Other recent and upcoming papers include: • Angular clustering of galaxies : Coil et al., 2004, ApJ, 617, 765 • DEEP2 survey strategy & dark energy: Davis et al.,astro-ph/0408344 • Evolution of close-pairs/merger rates: Lin et al., 2004, ApJ, 617, 9 • Satellite galaxy kinematics: Conroy et al., astro-ph/0409305 • Galaxy groups in DEEP2: Gerke et al., in press, astro-ph/0410721 • Luminosity function: Willmer et al. & Faber et al., in prep. • Galaxy properties vs. environment at z~1: Cooper et al., in prep. • Group correlation function: Coil et al., in prep. • K+Agalaxies in the DEEP2 sample: Yan et al., in prep. • Void statistics in the DEEP2 sample: Conroy et al., in prep. • Overview of the DEEP2 sample: Faber et al., in prep. First semester’s data is public: http://deep.berkeley.edu/DR1
Possible systematics • To change Da2 by 0.5s, a systematic must change (l2-l1) by 0.0015Å rest frame, or (l2+l1)/2 by 0.15Å rest frame. Systematics tested so far are:
Previous measurements [OIII] emission lines provide lower nominal accuracies than absorption line/many-multiplet or natural reactor methods, but the physics is much simpler. It is this type of measurement which we can perform with DEEP2.
Effect of changing a Shown is the effect of a 5% change in a applied to an actual spectrum - we can detect evolution ~1/800 this large!
Tying down the wavelength solution • The wavelength scale for DEEP2 spectra is set using KrArNeXe arc lamps, with conventional techniques. • -Typically ~20 lines are used on each half of the detector, with RMS ~0.005Å about each fit. • However, the wavelength scale at the time of calibration may not match that at time of observation (e.g. due to change in focus due to thermal expansion). Temperature changes can be systematic! • To correct for this, we fit for wavelength differences between each slit’s sky spectrum and a high resolution sky spectrum from Fulbright & Osterbrock (1996).
Tying down the wavelength solution, II Cross-correlation gives a robust measurement of the local shift between the observed & template sky spectra. We fit this to quadratic order…
DEEP2 Update DEEP2 was designed to have comparable size and density to previous generation local redshift surveys and is ~50 times larger than previous surveys at z~0.3-1. • 4 fields totalling 3 square degrees • Most targets at 0.7<z<1.4 (median 0.94) • Each field 0.5o x <2o=20x60x1000 Mpc/h3 • >50,000 R~5000 spectra to RAB=24.1, typically covering 6500-9100Å;~40,000 redshifts net • >400 one hour exposures with the DEIMOS spectrograph, requiring 80 Keck nights DEEP2 began observations Summer 2002, and is now >80% complete. 3 of 4 fields will soon be done.
DEEP2/CFHT B,R,I GALEX NUV+FUV Chandra & XMM: Past coverage New Award (1.4Ms) Update on observations ofthe Extended Groth Strip (EGS) Spitzer MIPS, IRAC Background: 2 x 2 deg from POSS DEEP2 spectra and Caltech / JPL Ks imaging HST/ACS V,I (Cycle 13) Plus VLA (6 & 21 cm), SCUBA, etc….
[OIII] vs. Many-multiplet Bahcall et al. 2003 The first attempts to look for variations in a with QSOs used [OIII] emission (e.g. Bahcall & Salpeter 1965). Absorption lines became preferred as they could yield more measurements per spectrum (limited by # of absorbers, while each object has 1 redshift) and can be observed to higher z.
Be wary of highest & lowest z’s… Shown are residuals between single-spectrum and global fits to the perturbation to the wavelength system from skylines. Residuals are worst at the ends of the spectra.Quantifying now…