Download
1 / 30
320 likes | 563 Views
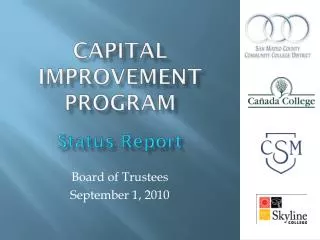
Capital Structure I:. Basic Concepts. S. S. B. B. The Capital-Structure Question and The Pie Theory. The value of a firm is defined to be the sum of the value of the firm ’ s debt and the firm ’ s equity. V = B + S. S. S. B. B.

E N D
Capital Structure I: Basic Concepts
S S B B The Capital-Structure Questionand The Pie Theory • The value of a firm is defined to be the sum of the value of the firm’s debt and the firm’s equity. • V =B + S S S B B If the goal of the management of the firm is to make the firm as valuable as possible, the the firm should pick the debt-equity ratio that makes the pie as big as possible. Value of the Firm
The Capital-Structure Question There are really two important questions: • Why should the stockholders care about maximizing firm value? Perhaps they should be interested in strategies that maximize shareholder value. • What is the ratio of debt-to-equity that maximizes the shareholder’s value? As it turns out, changes in capital structure benefit the stockholders if and only if the value of the firm increases.
Financial Leverage, EPS, and ROE Consider an all-equity firm that is considering going into debt. (Maybe some of the original shareholders want to cash out.) Current Assets $20,000 Debt $0 Equity $20,000 Debt/Equity ratio 0.00 Interest rate n/a Shares outstanding 400 Share price $50 Proposed $20,000 $8,000 $12,000 2/3 8% 240 $50
EPS and ROE Under Current Capital Structure Recession Expected Expansion EBIT $1,000 $2,000 $3,000 Interest 0 0 0 Net income $1,000 $2,000 $3,000 EPS $2.50 $5.00 $7.50 ROA 5% 10% 15% ROE 5% 10% 15% Current Shares Outstanding = 400 shares
EPS and ROE Under Proposed Capital Structure Recession Expected Expansion EBIT $1,000 $2,000 $3,000 Interest 640 640 640 Net income $360 $1,360 $2,360 EPS $1.50 $5.67 $9.83 ROA 5% 10% 15% ROE 3% 11% 20% Proposed Shares Outstanding = 240 shares
EPS and ROE Under Both Capital Structures All-EquityRecession Expected Expansion EBIT $1,000 $2,000 $3,000 Interest 0 0 0 Net income $1,000 $2,000 $3,000 EPS $2.50 $5.00 $7.50 ROA 5% 10% 15% ROE 5% 10% 15% Current Shares Outstanding = 400 shares LeveredRecession Expected Expansion EBIT $1,000 $2,000 $3,000 Interest 640 640 640 Net income $360 $1,360 $2,360 EPS $1.50 $5.67 $9.83 ROA 5% 10% 15% ROE 3% 11% 20% Proposed Shares Outstanding = 240 shares
Financial Leverage and EPS 12.00 Debt 10.00 8.00 No Debt Advantage to debt 6.00 Break-even point EPS 4.00 Disadvantage to debt 2.00 0.00 1,000 2,000 3,000 EBIT in dollars, no taxes (2.00)
Assumptions of the Modigliani-Miller Model • Homogeneous Expectations • Homogeneous Business Risk Classes • Perpetual Cash Flows • Perfect Capital Markets: • Perfect competition • Firms and investors can borrow/lend at the same rate • Equal access to all relevant information • No transaction costs • No taxes
B $ 800 2 = = 3 S $ 1 , 200 Homemade Leverage: An Example Recession Expected Expansion EPS of Unlevered Firm $2.50 $5.00 $7.50 Earnings for 40 shares $100 $200 $300 Less interest on $800 (8%) $64 $64 $64 Net Profits $36 $136 $236 ROE (Net Profits / $1,200) 3% 11% 20% We are buying 40 shares of a $50 stock on margin. (40% of funds borrowed) We get the same ROE as if we bought into a levered firm. Our personal debt equity ratio is:
Homemade (Un)Leverage:An Example Recession Expected Expansion EPS of Levered Firm $1.50 $5.67 $9.83 Earnings for 24 shares $36 $136 $236 Plus interest on $800 (8%) $64 $64 $64 Net Profits $100 $200 $300 ROE (Net Profits / $2,000) 5% 10% 15% Buying 24 shares of an other-wise identical levered firm along with the some of the firm’s debt gets us to the ROE of the unlevered firm. This is the fundamental insight of M&M
The MM Proposition I: Capital Structure and Firm Value • Assuming a un-levered firm, and funds from equity. • The after-tax profit is • The operation cash flows is • To maintain same asset size, the firm needs to invest, same as Dep., on capital. So the firm’s free cash flows becomes • The value of this un-levered firm, assuming perpetuity, is defined as ksuis the cost of capital (equity) for a un-levered firm.
For a levered firm, funds from both equity and debt. The total cash flow for firm can be divided by that goes to • Debt holders: where D is the value of debt, and kD is risk-free rate • Stockholders: • So the total cash flows to firm becomes • EBIT(1-t) is the same as that of un-levered firm, and tkD is a risk-free cash flow. So the value of firm is • When t=0, then VL = VU
Total Cash Flow to Investors Under Each Capital Structure with Corp. Taxes All-EquityRecession Expected Expansion EBIT $1,000 $2,000 $3,000 Interest 0 0 0 EBT $1,000 $2,000 $3,000 Taxes (Tc = 35% $350 $700 $1,050 Total Cash Flow to S/H $650 $1,300 $1,950 LeveredRecession Expected Expansion EBIT $1,000 $2,000 $3,000 Interest ($800 @ 8% ) 640 640 640 EBT $360 $1,360 $2,360 Taxes (Tc = 35%) $126 $476 $826 Total Cash Flow $234+640 $468+$640 $1,534+$640 (to both S/H & B/H): $874 $1,524 $2,174 EBIT(1-Tc)+TCrBB $650+$224 $1,300+$224 $1,950+$224 $874 $1,524 $2,174
The MM Proposition II, capital structure and Cost of Capital (No Taxes) • The cost of levered equity is defined as • The WACC is
The Cost of Equity, the Cost of Debt, and the Weighted Average Cost of Capital: MM Proposition II with No Corporate Taxes Cost of capital: r (%) r0 kD rB Debt-to-equity Ratio
The MM Proposition II, capital structure and Cost of Capital (With Taxes)
The MM Proposition II, capital structure and Cost of Capital (With Taxes)
The Effect of Financial Leverage on the Cost of Debt and Equity Capital with Corporate Taxes Cost of capital(%) ksu kD Debt-to-equityratio (D/S)
Integrate capital structure theory with the Capital Asset Pricing Model
Riskfree rate Operating risk premium Financial risk premium Leveled beta
Example: One firm which is currently totally equity financed. If its expected perpetual operating income is $10,000 per year, and last forever. Assuming its current cost of capital is 12%, and tax rate is 25%. • Question 1: What is the current market value for the firm? Current value of firm is
If the firm issues $40,000, 8%coupon bond and uses the proceeds to buy back common stock shares. What will be the new market value for the firm and equity after the leverage and buy back.
What is the new cost of equity after the debt financing? =0.12+(0.12-0.08)(1-0.25)(40,000/32,500)=15.69%
What is the new WACC for the firm after the debt financing? =15.69%(32,500/72,500)+8%(1-25%)(40,000/72,500) =10.34% =12%[1-0.25(40,000/72,500)]= 10.34%
One firm now has 20% debt and 80% equity. The CFO believes it can increase leverage to 40% debt financing without raising its 7% cost of debt. Assuming that and marginal tax rate is 25% • What is the current cost of equity and WACC for the firm? =7%+(15%-7%)*0.6=11.8% =11.8%(0.8)+7%(1-.25)(0.2)=10.49%
If the firm increases its debt ratio from 20% to 40%, what will be its WACC? • When debt ratio is 20%, When debt ratio increases to 40%
Alternatively, we can apply CAPM to conduct the calculation, when debt ratio is 20% When debt ratio increases to 40% =7%+(15%-7%)*0.7580 =13.064% =13.064% (0.6)+7%(1-0.25)(0.4)=9.94%
If the firm faces a project (same risk as the firm) with a return of 9.5%, should the firm accept the project? • No it should not. The project return 9.5% is lower than that of WACC 9.94%。