Download
1 / 28
280 likes | 416 Views
Instructional Leadership Direct Effect on Student Outcomes. Ali Korkmaz, Ph.D. Strategic Data Project Fellow Long Beach Unified School District Ahmet Uludag , Ph.D. Accord Institute for Education Research. Background. Principal effects on student outcomes Past Research Small Indirect

E N D
Instructional Leadership Direct Effecton Student Outcomes Ali Korkmaz, Ph.D. Strategic Data Project Fellow Long Beach Unified School District AhmetUludag, Ph.D. Accord Institute for Education Research
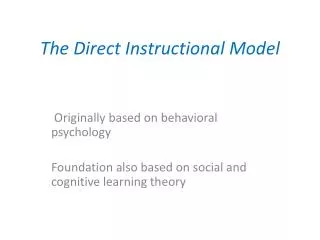
Background • Principal effects on student outcomes • Past Research • Small • Indirect • Mediated through other school factors • Recent studies (Education Next 2013, Educational Administration Quarterly 2012, Econ Papers 2011, School Effectiveness and School Improvement 2010) • Direct and indirect • NCLB (accountability) effects on the role of principals
Purpose of the studies • To understand “principal attention” impact on student growth • To understand the direct effects of principal-student discussions on student achievement and growth • To understand students reactions and actions based on these discussions
First Study (1st Year) • Student Survey • Instructional practices • Study habits, motivation • Home environment • School learning environment Student Fall Reading & Math Test Student Spring Reading & Math Test
First Study Design Elements • Northwest Evaluation Association (NWEA) MAP Test • Consortium on Chicago School Research (CCSR) Student Survey • Longitudinal growth for reading
NWEA MAP Tests A computer adaptive test tool • to measure student levels, placement and differentiate instruction to meet student needs • to guide curriculum and instructional decisions • to measure student growth over time • of accountability to see how well we have done our jobs; to measure the effectiveness of curriculum and instruction
Target Growth = 5 Spring Target RIT 215 Fall RIT 210 Spring Target RIT 202 Target Growth = 10 192 Fall RIT Target Growth for two 4th Grade Students
Student Survey • Consortium on Chicago School Research (CCSR) Surveys • More than 10 years in the field • IRT based (Rasch) survey items and constructs • It is designed mainly for school level analysis • Student survey items include: • Academic Engagement, Study Habits, Classroom Behavior, Learning Climate (Expectation, Relationships) • Subject area specific questions • School and home environment questions
Data (1st Study) • 846 students at 9 CA middle schools • 55% male • 50% free-reduced lunch • 11% African-American • 45% White • 44% Hispanic
Data Analyses • Students are grouped into 6 groups based on Fall proficiency and Fall to Spring Growth (progress in the same year) Effect-size Effect-size
Which of the following has the most impact on READING growth (for NON-PROFICIENT students)? • Principal attention • Teacher personal support • Teacher personal attention(ENGLISH) • Academic press(ENGLISH)
Which of the following has the most impact on reading growth (for non-proficient students)? Effect-size differences for most improving vs. most declining • Principal attention (.50) • Teacher personal support (.37) • Teacher personal attention(ENGLISH) (.34) • Academic press(ENGLISH) (.34)
Which of the following has the most impact on READING growth (for PROFICIENT students)? • Principal attention • Incidence of disciplinary action • Hours reading outside school • Parental support for student learning
Which of the following has the most impact on reading growth (for proficient students)? Effect-size differences for most improving vs. most declining • Principal attention (.37) • Incidence of disciplinary action (-.41) • Hours reading outside school (.48) • Parental support for student learning (.27)
Design of the 2nd Study (2nd Year) • Students (6th-8thgrades) who had Basic from Fall and Winter MAP Math test results eligible for the study (53 students) • 27 randomly identified and invited to participate • 15 accepted (parent consent) • 26 are control group • Principal meets with students in the Spring • Reviews CSTs, MAP tests • Gets student reactions to his/her results • Students set goals for themselves • Researcher interviews participating students • Students reactions to principal discussion • What students did afterwards
School Profile • Middle school in an urban area • Student body • 66% Free or reduced lunch • 71% Hispanic or Latino • 12% White • 6% African American
Data and Analyses • North West Evaluation Association (NWEA) MAP tests results (student level) • Target and growth comparisons with Norm data • CST Math results (2012 and 2013) • Semi-structured interviews with students • Constant comparative method (Glaser, 1965)
Methods • Mixed Methods – Explanatory Sequential Design(Creswell, 2003) • Qualitative methods used to help explain quantitative findings
How Did Students Perceive? • Participating experiment group • Except 1 all were positive • Students felt empowered • “I start believing more in myself.” • “It encouraged me to do more.” • “Principal was counting on me to be successful.” • “It pushed me to do better what I want to achieve.” • “I felt I needed to better. I should do better. Maybe a little better.”
How Did Students React? • Better awareness of what is available to them • “Motivated me to go to tutoring. I needed help in extra things.” • Using the available resources • “Teacher tutored me about my problems. It is not confusing.” • “I participated more in class. I asked for help. There was a lot of help.”
How Did Students React? • More strategic studying • “My teacher gave me more exercise on my problem areas.” • Pure more studying • “I studied more for the test. I Disciplined myself. I really worked hard to do better in future.” • “I tried my best afterwards. My tests (referring to course finals) were better.”
Implications So what … • More work on principals? • Maybe more focused • Maybe more programmatic • Throughout the year (Couple times a year) • Assistant principal/academic dean
Limitations • 1st Study • Student survey • Teacher input on classroom practices (teacher survey) • No teacher observation • Student growth • High stakes, any rewards etc. involved • 2nd study • Small group • One time event vs. established program • Bias • Selection • Students could have reflected only on all positives
Contact • Ali Korkmaz, Ph.D. akorkmaz@lbschools.net • AhmetUludag, Ph.D. auludag@accordeducation.org CERA – December 6th, 2013