The analysis of cross-tabulations
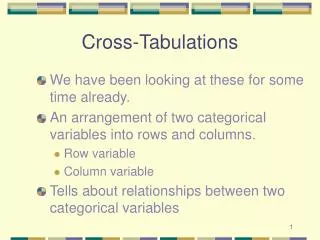
The analysis of cross-tabulations. Today. Chi-square test Fisher’s exact test Odds and odds ratios McNemars test. Where are we?. Cross-tabulations. Tables of countable entities Made to analyze the association, relationship, or connection between two variables

The analysis of cross-tabulations
E N D
Presentation Transcript
Today • Chi-square test • Fisher’s exact test • Odds and odds ratios • McNemars test
Cross-tabulations • Tables of countable entities • Made to analyze the association, relationship, or connection between two variables • This association is difficult to describe statistically • Null- Hypothesis: “There is no association between the two variables” can be tested • Analysis of cross-tabulations with larges samples
Delivery and housing tenure • Expected number without any association between delivery and housing tenure
Delivery and housing tenureIf the null-hypothesis is true • 899/1443 = 62.3% are house owners. • 62.3% of the Pre-terms should be house owners: 99*899/1443 = 61.7
Delivery and housing tenureIf the null-hypothesis is true • 899/1443 = 62.3% are house owners. • 62.3% of the ‘Term’s should be house owners: 1344*899/1443 = 837.3
Delivery and housing tenureIf the null-hypothesis is true • 258/1443 = 17.9% are council tenant. • 17.9% of the ‘preterm’s should be council tenant: 99*258/1443 = 17.7
Delivery and housing tenureIf the null-hypothesis is true • In general
Delivery and housing tenureIf the null-hypothesis is true • In general
Delivery and housing tenuretest for association • If the numbers are large this will be chi-square distributed. • The degree of freedom is (r-1)(c-1) = 4 • From Table 13.3 there is a 1 - 5% probability that delivery and housing tenure is not associated
Delivery and housing tenureIf the null-hypothesis is true • It is difficult to say anything about the nature of the association.
Break and Exercise • http://www.smi.hst.aau.dk/~cdahl/statM7/opgaver1.pdf • A group of researchers wanted to predict the death from ventilator associated pneumonia in patients admitted to an intensive care unit. The authors measures the blood concentration of proANP on day 0 (D0) and day 4 (D4) after diagnosed ventilator associated pneumonia. They also recorded the age and gender of the patients. They used this data to predict non-survivors. In the study-group 71 patients were enrolled of which 26 died. • The percent of males and females distributed between survivors and non-survivors are shown below. • Use the 2-test to test for association between gender and survival. Is there a significant association? • Is the 2-test valid in this case?
Chi-squared test for small samples • Expected valued • > 80% >5 • All >1
Chi-squared test for small samples • Expected valued • > 80% >5 • All >1
Fisher’s exact test • An example
Fisher’s exact test • Survivers: • a, b, c, d, e • Deaths: • f, g, h • Table 1 can be made in 5 ways • Table 2: 30 • Table 3: 30 • Table 4: 5 • 70 ways in total
The properties of finding table 2 or a more extreme is: Fisher’s exact test • Survivers: • a, b, c, d, e • Deaths: • f, g, h • Table 1 can be made in 5 ways • Table 2: 30 • Table 3: 30 • Table 4: 5 • 70 ways in total
Odds and odds ratios • Odds, p is the probability of an event • Log odds / logit
Odds • The probability of coughs in kids with history of bronchitis. p = 26/273 = 0.095 o = 26/247 = 0.105 The probability of coughs in kids with history without bronchitis. p = 44/1046 = 0.042 o = 44/1002 = 0.044
Odds ratio • The odds ratio; the ratio of odds for experiencing coughs in kids with and kids without a history of bronchitis.
Is the odds ratio different form 1? • We could take ln to the odds ratio. Is ln(or) different from zero? • 95% confidence (assumuing normailty)
Confidence interval of the Odds ratio • ln (or) ± 1.96*SE(ln(or)) = 0.37 to 1.38 • Returning to the odds ratio itself: • e0.370 to e1.379 = 1.45 to 3.97 • The interval does not contain 1, indicating a statistically significant difference
Odds ratios in SPSS (Risk) • SPSS uses binomial distributions not normal as shown here
Exercises • http://person.hst.aau.dk/cdahl/statM7/