
120 o E
E N D
Presentation Transcript
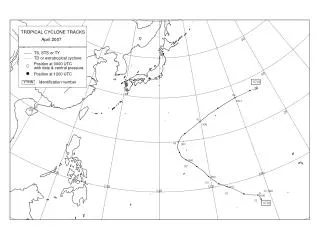
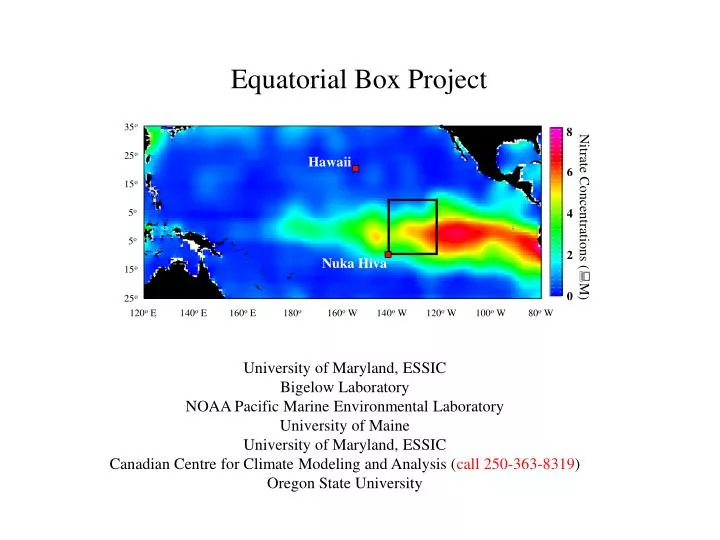
Equatorial Box Project 35o 35o 8 25o 25o Hawaii 6 15o 15o 4 Nitrate Concentrations (M) 5o 5o 5o 5o 2 Nuka Hiva 15o 15o 0 25o 25o 120o E 140o E 160o E 180o 160o W 140o W 120o W 100o W 80o W University of Maryland, ESSIC Bigelow Laboratory NOAA Pacific Marine Environmental Laboratory University of Maine University of Maryland, ESSIC Canadian Centre for Climate Modeling and Analysis (call 250-363-8319) Oregon State University
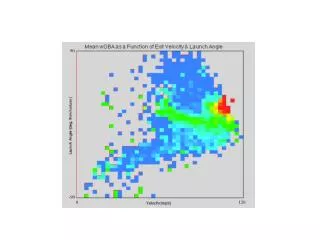
This graphic shows the first principal component for the full model domain for SST, SSS, and surface NO3, DIC, nDIC, and pCO2 (nDIC is DIC normalized to constant S=35), and the means of these same fields within the 'box'. As you can see, the box mean is a pretty good indicator of the largest mode of variability across the whole domain. Jim
Revisiting the Box Project Proposal • Top-level Objective: • Pilot study addressing the question, “To what degree can we confidently detect and predict change in carbon cycle components of aquatic systems and what are currently the greatest sources of uncertainty?” • Key Components: • Evaluation and intercomparison of ‘Conversion Models’ and ‘Coupled Models’ focused on the surface mixed layer within the Equatorial Box and involving comparisons with field data
Revisiting the Box Project Proposal • Proposed Approach: • Four field studies. After first cruise, results will be used to test and tune model parameters. Models will then be executed to predict Box properties during second cruise. After second cruise, results will be compared to predictions and models further adjusted. Cycle continued for all cruises. • Key Properties: • Algal biomass, primary production, POC and DOC • Additional Questions: • How do uncertainties in model predictions change if uncertainties in initial conditions are reduced? Do predictions improve if the model state is fit to extensive observations at time zero? • Can information on advective properties within the study volume, from measurements or the Coupled model, improve predictions of the Conversion models by providing insights into the recent history of the water mass?
Revisiting the Box Project Proposal • Conversion Model #1: POC • Compare/relate field measurements of cp and bbp to POC • Compare field bbp to satellite inversion bbp • Calculate POC from satellite and compare to coupled model • Conversion Model #2: DOC • Compare/relate field measurements of cDOM and DOC – possibly employ additional properties • Compare field cDOM with satellite cDOM • Calculate DOC from satellite and compare to coupled model • Conversion Model #3: Algal biomass & Productivity • Compare field pigment biomass to SeaWiFS and MODIS standard pigment products • Evaluate phytoplankton carbon biomass estimates from scattering properties • Compare Chl:C variability with physiological properties (PI data) • Compare field NPP data to field-based and satellite-based NPP estimates from chlorophyll- • based models (e.g., VGPM) and carbon-based model (CbPM) • Evaluate relationship between NPP model error and variable fluorescence properties • Calculate NPP using field-tuned NPP models and compare to coupled model • Coupled Model Analysis • Compare model estimates of algal biomass (carbon, chlorophyll), NPP, POC, and DOC with field data • Conduct comparisons with ‘Conversion Models’ identified above
Revisiting the Box Project Proposal • Deliverables • “…an overarching goal for us is, at the end of this study, to be able to provide a quantitative, although regionally restricted, answer to the question of how well Conversion and Coupled models are able to describe and forecast variability in a select set of carbon cycle components. We also anticipate that, from this study, a more complete understanding will be achieved regarding similarities and differences between model classes and the basis for the discrepancies. At a more fundamental level, this project will (1) lead to a better characterization of a truly interdisciplinary ocean-atmosphere system that is a major component of the global carbon cycle, (2) contribute to the evaluation/application of remote sensing products and to the development of new products, (3) provide much-needed testbed data at an appropriate scale for evaluating future Coupled models, and (4) provide important new insights on forcing-response relationships for key model variables, such as N:C and C:Chl ratios.”
Achievements of the Box Project Thanks! Julie & Rois
Achievements of the Box Project Thanks! Kirby, Wayne mike
Achievements of the Box Project Thanks! Julie, Rois & Wayne
Achievements of the Box Project Thanks! Toby, Kirby & mike
Achievements of the Box Project Measured properties:
Meeting Outline • Day I • 1) Project Overview (Mike) • 2) Collin (HPLC, 14C, cruise 1 optics, remote sensing reflectance) • 3) Emmanuel / Wayne (optics cruise 2 and 3) • 4) Break • 5) Giorgio (cruise 3 AC-S, cruise 4 prelim. results, Pete’s data) • 6) Mike (PAR, FRR, POC, PON, turner chlorophyll) • Lunch • 7) Toby – Conversion model products • 8) Wendy – Coupled model result • 9) Jim Christian – More modeling (shoot for 3:30/3:45) • 9) Group Discussion • Cross-cutting themes • Model-model and model-data comparisons • 10) Breakout • Subgroup real-time comparisons • Data reanalysis • ….or simply time for a walk, run, swim, etc…. • 11) Reconvene – discussion of breakout results • Dinner – Lobster!
Meeting Outline • Day II • Year 3 planning • Challenges and division of labor • Schedule for Cruise 4 data analysis and delivery • Schedule of milestones • Near-term papers • Synthesis paper • Next meeting Copy of powerpoints for everyone + will distribute