

URINALYSIS
E N D
Presentation Transcript
URINALYSIS IF YOU CAN SEE THIS MESSAGE YOU ARE NOT IN “SLIDE SHOW” MODE. PERFOMING THE LAB IN THIS MODE WILL NOT ALLOW FOR THE ANIMATIONS AND INTERACTIVITY OF THE EXERCISE TO WORK PROPERLY. TO CHANGE TO “SLIDE SHOW” MODE YOU CAN CLICK ON “VIEW” AT THE TOP OF THE PAGE AND SELECT “SLIDE SHOW” FROM THE PULL DOWN MENU. YOU CAN ALSO JUST HIT THE “F5” KEY. Click Here to Start the Lab Instructor Terry Wiseth
WHAT DO I NEED TO HAND IN WITH THIS LAB • When your are finished with this lab you will need to hand in the following for your lab report. Remember that all labs must have a cover sheet attached to the lab. • Macroscopic Observations Data Sheet • Chemstix Urinalysis Data Sheet • Microscopic Observations Data Sheet • Answers to Questions 1-7 URINALYSIS LAB Click on the blackboard to view a larger blackboard for discussion Urine Sample Click Here toContinue
URINALYSIS LABAt any point you can use your escape key to end the lab Urine Sample Click Here to Go Directly to Macroscopic Observations Click Here to Go Directly to Chemstix Urinalysis Click Here to Go Directly to Microscopic Observations Click Here to Go Directly to Urinalysis Questions If you are just starting this lab you should click on the CONTINUE button to the right Click Here toContinue
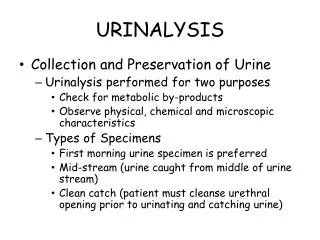
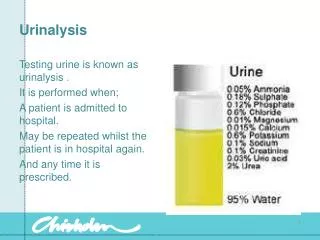
Tests on urine can provide clues to many diseases and information about your overall health. A routine urine screening test may be done to help find the cause for many types of symptoms. The kidneys remove waste material, minerals, fluids, and other substances from the blood for elimination in the urine. Therefore, urine can contain hundreds of different bodily waste products. Many factors (such as diet, fluid intake, exercise, and kidney function) affect what is in urine. URINALYSIS LAB Click on the blackboard to view a larger blackboard for discussion Urine Sample Click Here toContinue
A urine test may be done as part of a routine physical examination to screen for a disease or infection of the urinary tract. Symptoms that may lead to a urine test include discolored or foul-smelling urine, pain during urination, difficulty urinating, flank pain, or fever. Urine tests are also performed to monitor the treatment of certain conditions such as diabetes, kidney stones, a urinary tract infection, hypertension, or some types of kidney or liver disease. Urine Sample Click Here toContinue
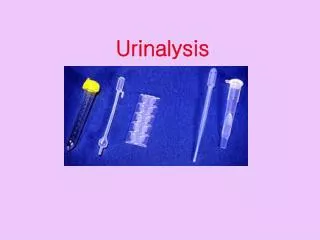
Macroscopic examination requires only that the observer has a sense of sight and smell. The most cost-effective device used to screen urine chemistry is a plastic dipstick. This microchemistry system has been available for many years and allows qualitative and semi-quantitative analysis within a few minutes by simple but careful observation. The color change occurring on each segment of the strip is compared to an established color chart to obtain results. Microscopic urinalysis requires only a relatively inexpensive light microscope. Urine Sample Click Here toContinue
In this lab we will perform three types of analysis on a urine sample. • 1) MACROSCOPIC OBSERVATIONS • 2) CHEMSTIX ANALYSIS • 3) MICROSCOPIC OBSERVATIONS • For all three analysis you will need to complete data sheets describing your observations. You will need to print these data sheets out in order to record your data. Urine Sample Click Here toContinue
You can access the data sheets and questions you will need by utilizing the links below. Urine Sample Macroscopic ObservationsData Sheet Chemstix UrinalysisData Sheet Microscopic ObservationsData Sheet Urinalysis Questions Click Here toContinue
The urine sample was collected at the same time that you started the lab. You most likely viewed the collection process. The urine sample is potentially contaminated with pathogens. Wear latex barrier gloves and protective eyewear during the entire exercise. Place all disposable material that comes into contact with urine in the biohazard bag. Good luck and be careful. Urine Sample Click Here toContinue
MACROSCOPIC OBSERVATIONS Click Here to Go Back to where you came from Click Here toContinue
URINALYSIS LABAt any point you can use your escape key to end the lab Urine Sample Click Here to Go Directly to Macroscopic Observations Click Here to Go Directly to Chemstix Urinalysis Click Here to Go Directly to Microscopic Observations Click Here to Go Directly to Urinalysis Questions Click Here toContinue
MACROSCOPIC OBSERVATIONS • The first part of a urinalysis is direct visual observation. We will observe the following characteristics of the urine sample. Be sure to enter your observations in the appropriate data table. • COLOR • TURBIDITY • ODOR • Be sure you have printed off the Data Sheet Urine Sample Macroscopic ObservationsData Sheet Click Here toContinue
COLOR Normal, fresh urine is pale to dark yellow or amber in color and clear. The yellow color is due to the pigment urochrome, a metabolic product of hemoglobin breakdown. A red or red-brown (abnormal) color could be from a food dye, eating fresh beets, a drug, or the presence of either hemoglobin or myoglobin. If the sample contained many red blood cells, it would be cloudy as well as red. Urine Sample Click Here toContinue
COLOR The intensity of the color generally indicates the concentration of the urine; pale or colorless urine indicates that it is dilute. Colorless urine may be caused by conditions such as long-term kidney disease or uncontrolled diabetes. Deep yellow urine indicates that it is concentrated. Dark yellow urine can be caused by conditions such as low fluid intake or dehydration. Vitamin B supplements can also turn urine bright yellow. Urine Sample Click Here toContinue
COLOR • The color of the urine sample is assessed subjectively and reported as: • -Colorless-Light to medium yellow-Very dark yellow-Red to brownish red-Reddish brown to brown-Greenish tint Urine Sample Click Here toContinue
COLOR Some examples of various urine colors and corresponding common causes are shown below: Urine Sample Click Here toContinue
Click on the urine sample on the shelf and record the Color and Intensity of color in your data table. Urine Sample Click Here toContinue
TURBIDITY Also called transparency, opacity or clarity, this test determines the cloudiness of urine. Urine is normally clear. Bacteria, blood, sperm, crystals, or mucus can make urine appear cloudy. The turbidity of the urine sample is gauged subjectively and reported as:-clear -slightly cloudy -cloudy -opaque -flocculent (cannot see through) Urine Sample Click Here toContinue
TURBIDITY Normally, fresh urine is clear to very slightly cloudy. Excess turbidity results from the presence of suspended particles in the urine. The cause can usually be determined based on the results of the microscopic urine sediment examination. The turbidity in the sample to the right was due to numerous crystals which precipitated upon cooling of the specimen to room temperature. Urine Sample Click Here toContinue
TURBIDITY • Common causes of abnormal turbidity include : • -increased cells (RBC, WBC) • -numerous crystals • -bacteria • -lipiduria (lipids often rise to the surface) • -mucus • -semen • -fecal contamination Urine Sample Click Here toContinue
TURBIDITY Three urine samples are shown. The one at the left shows a red, cloudy appearance. The one in the center is red but clear. The one on the right is yellow, but cloudy Urine Sample Click Here toContinue
Click on the urine sample on the shelf and record the Turbidity in your data table. Urine Sample Click Here toContinue
ODOR A normal odor for urine is a slightly "nutty" (aromatic) smell. Some foods (such as asparagus), vitamins, and antibiotics (such as penicillin) can cause urine to develop an unusual odor. Urine Sample Click Here toContinue
ODOR Some diseases can cause a change in the normal odor of urine. For example, an infection with E. coli bacteria can cause a foul odor while diabetes or starvation can cause a sweet, fruity odor. Urine that smells like maple syrup can indicate maple syrup urine disease, a condition caused by the body's inability to break down certain amino acids. Urine Sample Click Here toContinue
Click on the urine sample on the shelf. Sample the urine with your virtual nose and record the Odor in your data table. Urine Sample A virtual nose is supplied in this instance. If you can identify the images emanating from the urine sample to the virtual nose, you will be able to enter a characteristic odor of the sample to the data sheet. If you are not able to identify the images click on the word ODOR below ODOR Click Here toContinue
MACROSCOPIC OBSERVATIONS You have now completed your Macroscopic Observations on the urine sample. Be sure you have entered the data required on the Data Sheet you have printed out. If you need to return to the start of the Macroscopic Observations, you can use the links supplied below. Urine Sample Click Here to Print the Data Sheet Click Here to Return to start of Macroscopic Observations Click Here toContinue
CHEMSTIX ANALYSIS Click Here to Go Back to where you came from Click Here toContinue
URINALYSIS LABAt any point you can use your escape key to end the lab Urine Sample Click Here to Go Directly to Macroscopic Observations Click Here to Go Directly to Chemstix Urinalysis Click Here to Go Directly to Microscopic Observations Click Here to Go Directly to Urinalysis Questions Click Here toContinue
Chemstix CHEMSTIX ANALYSIS Chemstix strips are composed of sections of paper with test reagents embedded into the fibers. They react with urine components if present. The Chemstix are divided into ten individual panels which will change color in accordance with components that may be present in the urine sample. We can then compare the color changes to a color panel chart to assist in determining urine components. Urine Sample Click Here toContinue
Chemstix CHEMSTIX ANALYSIS The Chemstix below indicates the type of test that will be performed for each of the individual panels on the Chemstix. You will not have to memorize the panel key below. As each test is performed a key will be provided for you. Urine Sample Nitrite Protein Blood Ketone Glucose Leukocytes Urobinogen pH SpecificGravity Bilirubin Click Here toContinue
CHEMSTIX COLOR CHART Negative Trace Small Moderate Large LEUKOCYTES 0.2 1 2 4 8 UROBILINOGEN Negative ----------Positive--------NITRITE (Any degree of color change) Negative Trace 33 100 200 2000 PROTEIN 5.0 6.0 6.5 7.0 7.5 8.0 8.5 pH NegativeTrace Moderate Trace Small Moderate Large BLOOD Non-Hemolyzed Hemolyzed 1.000 1.005 1.010 1.015 1.020 1.025 1.030 SPECIFICGRAVITY Negative Trace Small Moderate Large X Large KETONE Negative Small Moderate Large BILIRUBIN Negative 100 250 500 1000 2000 GLUCOSE CHEMSTIX ANALYSISThe chart to the left is what we will compare our sampled Chemstix against to determine the characteristics of the urine sample. You will not need to memorize the table as it will be provided to you as you perform the tests. Urine Sample Click Here to View a Printable Page of the Chemstix Color Chart Click Here toContinue
CHEMSTIX ANALYSIS We are now ready to perform tests on the urine sample that will analyze for the following characteristics:-specific gravity -pH -protein -glucose -ketones Be sure you have printed off the Data Table Urine Sample -nitrites-bilirubin-hematuria-urobilinogen-leukocytes Chemstix UrinalysisData Sheet Click Here toContinue
CHEMSTIX ANALYSIS The chart below shows what abnormalities may be associated with abnormal urine characteristics. Urine Sample Click here to print this chart Click Here toContinue
SPECIFIC GRAVITYSpecific gravity measures the amount of substances dissolved in the urine. It also indicates how well the kidneys are able to adjust the amount of water in urine. Specific gravity can be considered to measure urine density, or the ability of the kidney to concentrate or dilute the urine over that of plasma.Urine specific gravity is a measurement of the density of urine compared to pure water. The specific gravity of water is 1.00. Urine Sample Click Here toContinue
SPECIFIC GRAVITYThe higher the specific gravity, the more solid material is dissolved in the urine. When you drink a lot of liquid, your kidneys should produce greater-than-normal amounts of dilute urine. When you drink very little liquid, your kidneys should make only small amounts of concentrated urine. Urine specific gravity can be determined using a Chemstix. Urine Sample Click Here toContinue
SPECIFIC GRAVITYNormal specific gravity of urine is measured at 1.005 – 1.035. • Abnormally low specific gravity indicates dilute urine, which may be caused by: • - drinking excessive amounts of liquid • - severe kidney disease • - the use of diuretics Urine Sample Click Here toContinue
SPECIFIC GRAVITYAbnormally high specific gravity indicates very concentrated urine, which may be caused by: • - not drinking enough liquid • - loss of too much liquid (excessive vomiting, sweating, or diarrhea) • - substances (such as sugar or protein) in the urine Urine Sample Click Here toContinue
Multistix Multistix Multistix Click on the Chemstix bottle on the shelf. Next click on the cover of the bottle to obtain a few of the Chemstix. Chemstick Click Here toContinue
Multistix Multistix Multistix Click on the one of the Chemstix on the table to sample the urine. Now click on the blue button on top of the timer and leave the Chemstix in the urine sample for two minutes. Urine Sample Chemstick 2 Minute Timer Click Here toContinue
Multistix Multistix Multistix The color panels on the Chemstix will change color in relation to the characteristics of the urine sample. Each of the color panels is associated specifically with a single urine characteristic. Urine Sample Chemstick 2 Minute Timer Click Here toContinue
Multistix Multistix Multistix Click on the Chemstix in the urine sample to compare the stick to the color chart to read the Specific Gravity for the sample. Read the color panel indicated by the arrow above the stick. Click on the CHEMSTIX to view a magnified view of the CHEMSTIX Urine Sample Chemstick 2 Minute Timer Click Here toContinue
CHEMSTIX COLOR CHART Negative Trace Small Moderate Large LEUKOCYTES Chemstix 0.2 1 2 4 8 UROBILINOGEN Negative ----------Positive--------NITRITE (Any degree of color change) Negative Trace 33 100 200 2000 PROTEIN 5.0 6.0 6.5 7.0 7.5 8.0 8.5 pH NegativeTrace Moderate Trace Small Moderate Large BLOOD Non-Hemolyzed Hemolyzed 1.000 1.005 1.010 1.015 1.020 1.025 1.030 SPECIFICGRAVITY Negative Trace Small Moderate Large X Large KETONE Negative Small Moderate Large BILIRUBIN Negative 100 250 500 1000 2000 GLUCOSE Compare the color of the panel indicated by the arrow to the color chart for Specific Gravity and record the value indicated in the data table for Chemstix Urinalysis. SpecificGravity Click Here toContinue
pHThe pH is a measure of how acidic or alkaline (basic) the urine is. A urine pH of 4 is strongly acidic, 7 is neutral (neither acidic nor alkaline), and 9 is strongly alkaline. Sometimes the pH of urine may be adjusted by certain types of treatment. For example, efforts may be made to keep urine either acidic or alkaline to prevent formation of certain types of kidney stones. Urine Sample Click Here toContinue
pH Normal pH for urine ranges from 4.5 – 8.0. Some foods (such as citrus fruit and dairy products) and medications (such as antacids) can affect urine pH. In a diet high in protein the urine is more acidic, while a diet high in vegetable material yields a urine that is more alkaline. Urine Sample Click Here toContinue
pH A high (alkaline) pH can be caused by prolonged vomiting, a kidney disease, some urinary tract infections, and asthma. A low (acidic) pH may be a sign of severe lung disease (emphysema), uncontrolled diabetes, aspirin overdose, prolonged diarrhea, dehydration, starvation, drinking an excessive amount of alcohol, or drinking antifreeze (ethylene glycol). Urine Sample Click Here toContinue
CHEMSTIX COLOR CHART Negative Trace Small Moderate Large LEUKOCYTES 0.2 1 2 4 8 UROBILINOGEN Negative ----------Positive--------NITRITE (Any degree of color change) Negative Trace 33 100 200 2000 PROTEIN 5.0 6.0 6.5 7.0 7.5 8.0 8.5 pH Chemstix NegativeTrace Moderate Trace Small Moderate Large BLOOD Non-Hemolyzed Hemolyzed 1.000 1.005 1.010 1.015 1.020 1.025 1.030 SPECIFICGRAVITY Negative Trace Small Moderate Large X Large KETONE Negative Small Moderate Large BILIRUBIN Negative 100 250 500 1000 2000 GLUCOSE Compare the color of the panel indicated by the arrow to the color chart for pH and record the value indicated in the data table for Chemstix Urinalysis. pH Click Here toContinue
PROTEIN Normal urine contains little protein. Negative to trace reactions are usual in concentrated urine. A Chemstix protein reaction greater than 33 in concentrated or dilute urine indicates significant proteinuria. There are numerous causes of proteinuria, the most common of which are urinary tract inflammation, hematuria, and glomerular disease. Urine Sample Click Here toContinue
PROTEIN Proteinuria is usually a sign of kidney disorders, but it may occur normally after strenuous exercise such as marathon running. Fever, strenuous exercise, normal pregnancy, and some diseases (especially kidney disease) may also cause protein in the urine. Protein in the urine can also be caused by heart failure, leukemia, poison (lead or mercury poisoning), or a condition during pregnancy that results in high blood pressure (preeclampsia). Urine Sample Click Here toContinue
CHEMSTIX COLOR CHART Negative Trace Small Moderate Large LEUKOCYTES 0.2 1 2 4 8 UROBILINOGEN Negative ----------Positive--------NITRITE (Any degree of color change) Negative Trace 33 100 200 2000 PROTEIN 5.0 6.0 6.5 7.0 7.5 8.0 8.5 pH Chemstix NegativeTrace Moderate Trace Small Moderate Large BLOOD Non-Hemolyzed Hemolyzed 1.000 1.005 1.010 1.015 1.020 1.025 1.030 SPECIFICGRAVITY Negative Trace Small Moderate Large X Large KETONE Negative Small Moderate Large BILIRUBIN Negative 100 250 500 1000 2000 GLUCOSE Compare the color of the panel indicated by the arrow to the color chart for Protein and record the value indicated in the data table for Chemstix Urinalysis. Protein Click Here toContinue
GLUCOSE Glucose is the type of sugar usually found in blood. Normally there is very little or no glucose in urine. However, when the blood sugar level is very high, as in uncontrolled diabetes, it spills over into the urine. Glycosuria (excess sugar in urine) generally means diabetes mellitus. Glucose can also be present in urine when the kidneys are damaged or diseased. Urine Sample Click Here toContinue