
Comparing Neural Models of Turtle Visual Cortex Using the Davis Data Viewer
This study illustrates the use of the Davis data viewer for comparing two models of turtle visual cortex: the original and a modified version. Davis facilitates the simultaneous display of dynamic data, allowing for detailed exploration of neuron interactions and cortical function. Featuring direct views and spatial-temporal activity diagrams, the comparison includes analyses of lateral, medial, and stellate neuron activity under different stimulation conditions. This work highlights the significance of innovative data visualization in neuroscience research.

Comparing Neural Models of Turtle Visual Cortex Using the Davis Data Viewer
E N D
Presentation Transcript
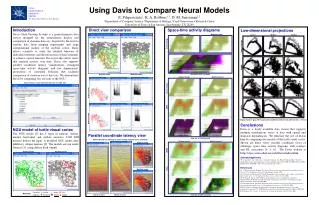
Lateral CAJAL NEUROSCIENCE RESEARCH CENTER The University of Texas at San Antonio 122 122 Original model Modified model Original model Modified model Lateral Medial Stellate Soma voltage Soma Voltage AMPA time line at 0.341 seconds Original model Modified model Davis interface is built automatically from user XML files GabaA time line at 0.444 seconds Original model Original model Modified model NMDA Modified model Original model time line at 0.074 seconds Modified model Excitatory: LGN Medial Neurons: Inhibitory: Horizontal Subpial Stellate Using Davis to Compare Neural Models E. Pilipaviciute1, K. A. Robbins1,3, D. M. Senseman2,3 1Department of Computer Science 2Department of Biology 3Cajal Neuroscience Research Center University of Texas at San Antonio, San Antonio, TX 78249 Conclusions Davis is a freely available data viewer that supports multiple simultaneous views of data with spatial and temporal dependencies. We illustrate the use of Davis here by comparing two models of the turtle visual cortex. Shown are direct views, parallel coordinate views of orderings, space time activity diagrams with overlays and KL caricatures [4, 5, 6]. The Davis website is http://vip.cs.utsa.edu/research/Davis/index.html. Acknowledgements We are grateful to our collaborators on the turtle brain project, Philip Ulinski and Bijoy Ghosh, for sharing their models and insight. This work was partially supported by NIH (G12 RR13646) and NSF EIA-0217884, NSF-NIH collaborative research in neuroscience. References [1] J. M. Bower and D. Beeman, The Book of Genesis: Exploring Realistic Neural Models with the General Neural Simulation System, 2nd Ed, Springer-Verlag, 1998. [2] Z. Nenadic, B. Ghosh, and P. Ulinski, Propagating waves in visual cortex: A large-scale model of turtle visual cortex, J. of Computational Neuroscience, 14(2):161-184, 2003. [3] W. Wang, B. Ghosh, and P. Ulinksi, Integrative physiology of subpial cells, submitted. [4] K. Robbins, M. Robinson and D. Senseman, Visualizing cortical waves and timing from data, IEEE Visualization ‘2004, 401-408, 2004. [5] K. Robbins and D. Senseman, Extracting wave structure from biological data with application to responses in turtle visual cortex, J. Computational Neuroscience, 16:267-298, 2004. [6] K. Robbins, I. Grinshpan, K. Allen and D. Senseman, Synchronized views for exploring populations of neurons, Proc. SPIE (Papers selected from Visualization and Data Analysis 2004, Eds R. F. Erbacher, P. C. Chen, J. C. Roberts, M. T. Gröhn, K. Börner), 5295:235-245, 2004. Introduction Davis (Data Viewing System) is a general-purpose data viewer designed for the simultaneous display and comparison of dynamic data sets. Inspired by the need to explore data from imaging experiments and large computational models of the cerebral cortex, Davis allows scientists to study the detailed behavior of individual elements and the interaction of these elements to achieve cortical function. Davis provides direct views that animate activity over time. Davis also supports parallel coordinate latency visualizations, remapped space-time activity diagrams, and low dimensional-projections of correlated behavior that facilitate comparison of structure across data sets. We demonstrate Davis by comparing two versions of the NGU. Direct view comparison Space-time activity diagrams Low-dimensional projections Soma voltage AMPA Original model in gray with magenta dot, modified model in black with red dot, t = 150 ms. NGU model of turtle visual cortex The NGU model [2] has 4 types of neurons (lateral, medial, horizontal and stellate neurons). LGN HH neurons deliver the input. A modified NGU model adds inhibitory subpial neurons [3].The models are run under Genesis [1] using diffuse flash stimuli. Parallel coordinate latency view Half-height latency ordering for lateral voltage (original versus modified) NMDA Original model Modified model GabaA Lateral neurons Medial neurons


