Download
1 / 24
240 likes | 350 Views
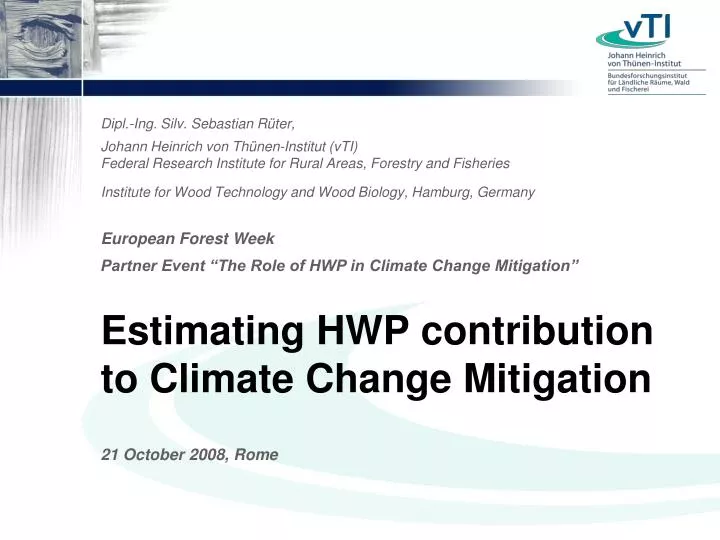
Dipl.-Ing. Silv. Sebastian Rüter, Johann Heinrich von Thünen-Institut (vTI) Federal Research Institute for Rural Areas, Forestry and Fisheries Institute for Wood Technology and Wood Biology, Hamburg, Germany. Estimating HWP contribution to Climate Change Mitigation. European Forest Week

E N D
Dipl.-Ing. Silv. Sebastian Rüter, Johann Heinrich von Thünen-Institut (vTI)Federal Research Institute for Rural Areas, Forestry and Fisheries Institute for Wood Technology and Wood Biology, Hamburg, Germany Estimating HWP contribution to Climate Change Mitigation European Forest Week Partner Event “The Role of HWP in Climate Change Mitigation” 21 October 2008, Rome
background background carbon storage effect substitution effect resume
Article 3.4 KP FM Forest management Estimation of emissions/removals from carbon pool/stock changes (source/sink) on national level (5 pools for 3.4 KP FM) Forests are considered in GHG Inventories and in the emission reduction targets (Annex I) FOREST IN THE KYOTO PROTOCOL Article 3.3 KP ARD Afforestation Reforestation Deforestation
- -440 MT CO2-eq. in 2005 due to increasing forest area in Europe GHG INVENTORIES GHG Inventory Data of EU (27) acc. to sectors [in BT CO2-eq.] • 1. Energy (combustion of fossil fuels) • 1.A.1 Energy industries • 1.A.2 Manufacturing and construction • 1.A.3 Transport • Industrial processes (incl. mineral products & metal production) • Agriculture • LULUCF • 5.A Forest land • 5.B Cropland • 5.C Grassland • 6. Waste 2005 1990 Source: UNFCCC (2008) -1 0 1 2 3 4 5
DEFORESTATION Deforestation as one of the biggest sources of CO2 on global level [in Bt CO2 y-1] Source: Schlamadinger and Marland (2000) ~ 20% (mainly deforestation)
WOOD PRODUCTS IN CLIMATE POLICIES Kyoto-Protocol Wood products currently excluded from accounting Possible consideration under post-2012 climate regime (Copenhagen) National GHG-Inventories (UNFCCC) • Suggestion of default assumption “that all carbon removed in wood […] from forests is oxidised in the year of removal” (IPCC Guidelines 1996 Vol. 3 p 5.17) • However, guidelines recommend the inclusion of HWPs in case stocks are increasing and sufficient data are available • Australia, Canada, Great Britain and USA • Methodology provided in Good Practice Guidance 2003
background carbon storage effect substitution effect resume
Only trees remove carbon from the atmosphere, thus being able to serve as a carbon sink. Wood products only constitute a pool for carbon. TERMINOLOGY Carbon storage along wood products life cycle = store/pool CO2 CO2 process chain = removal = emission building sawnwood forest roundwood post-consumer wood
METHODOLOGY FOR HWP Carbon storage of HWPs in post-2012 climate regime CO2 = store/pool CO2 = removal = emission building sawnwood furniture forest roundwood post-consumer wood wood based panels packaging products in market segments
METHODOLOGY FOR HWP Carbon storage of HWPs in post-2012 climate regime = store/pool “ ” CO2 CO2 building sawnwood forest roundwood furniture Estimationof CO2-emissionsin LULUCF sectoron basis of annual stock changes wood products as well? post-consumer wood Use in the market determinesthe duration of carbon storage Estimation of wood products contribution to LULUCF on the basis of service life data or by means of decay functions (IPCC HWP Model, tier 1) wood ased panels Need to calculate CO2-emissions from HWPs recursively packaging products in market segments
Who (consumer/producer) accounts for what? On which basis (data)? WOOD PRODUCTS ACCOUNTING Approaches for accounting currently being discussed Stock Change Production Atmospheric Flow Prerequisites for accounting Climate effects should be given priority Creation of positive incentives avoidance of leakage and perverse incentives (deforestation) sustainable forest management and cascade use Methodological consistency with LULUCF/AFOLU calculation of emissions on basis of Δwood products pool (consumption = production + import – export)
background carbon storage effect substitution effect resume
SUBSTITUTION EFFECT Substitution effect due to wood utilization CO2 CO2 CO2 building sawnwood forest roundwood Emissions from e.g. processingassessed by means of Life Cycle Assessment (LCA) post-consumer wood Impact categories Global Warming Potential(GWP 100) and energy consumption material Material and energy substitution energy
process or life stage 1 process or life stage 2 process or life stage 3 Raw material Product Side prod. process or life stage 2 Additives Emissions to: Air Energy Water Soil System boundary LIFE CYCLE ASSESSMENT Methodology LCA summarizes and evaluates all environmentally relevant material and energy flows, as well as all environmentally relevant effects of a product system (ISO EN 14040 and 14044) process or life stage 4 process or life stage 5
BMBF-PROJECT „ÖKOPOT“ – COMPARATIVE LCA Example interior wall systems Timber frame wall Metal frame wall Brick wall Calculation of substitution effect of a product only on thebasis of functional equivalent: Dimensions 5000 x 2500 mm Door way 875 x 2000 mm Sound reduction index Rw, R = 38 dB
INPUT OUTPUT BMBF-PROJECT „ÖKOPOT“ – COMPARATIVE LCA Modeling in LCA software Life cycle of building component
Substitution potential RESULTS FOR KEY INDICATORS Primary energy consumption (non-renewable / 100 y.) [in MJ] 4500 4000 3500 3000 2500 2000 1500 1000 500 0 Source: vTI und University of Stuttgart/LBP(2007) Timber frame wall Metal frame wall Brick wall
Substitution potential RESULTS FOR KEY INDICATORS GHG Potential (100 y.) [in kg CO2-eq.] 600 500 400 300 200 100 0 -100 -200 -300 -400 Timber frame wall Metal frame wall Brick wall Production and maintenance Fixed carbon Disposal (credit steam & power & recycling potential) Disposal (emitted) Source: vTI and University of Stuttgart/LBP (2007) 136 kg CO2-eq. (netto) 488 kg CO2-eq. (netto) 97 kg CO2-eq. (netto)
Brick wall Timber frame wall 72 % 7 % Metal frame wall 21 % Source: vTI and University of Stuttgart/LBP (2007) Scenario: Increase of market share of timber framed interior walls from 7 % to 30 % (brick: 60.5 %, metal: 9.5 %) to estimate substitution effect in Germany POTENTIAL SUBSTITUTION EFFECT ON NATIONAL LEVEL Substitution and GHG mitigation potential on national level
Substitutionseffekt Substitution effect: POTENTIAL SUBSTITUTION EFFECT ON NATIONAL LEVEL GHG potential (100 y.) [in 1000 T CO2-eq.] 1800 1600 1400 1200 1000 800 600 400 200 0 208,000 T CO2-eq. Timber frame wallMetal frame wall Brick wall Source: vTI and University of Stuttgart/LBP (2007) GHG potentialas-is state GHG potential30 % market share for timber
background carbon storage effect substitution effect resume
RÉSUMÉ Deforestationis one of the biggest sources of CO2-emissions globally Accounting for wood products considers storage effect, substitution effect (material/energy) indirectly considered already Any accounting should give priority to climate effects Accounting should incentivize sustainable forest management and cascade use and avoid negative impacts, e.g. deforestation LCA results show advantage of locally produced wood products – especially with respect to climate relevant indicators (energy consumption and GHG emissions) Storage effect calculated for estimating emissions/”removals”from HWP on basis of pool changes on national level Substitution effect assessed on product level – difficult to assess on national level Climate relevant LCA impact categories are lead indicators of sustainable building schemes Sustainable building schemes conceivable as policy instrument of climate policies
Thank you for your attention Further information www.holzundklima.de/en Contact sebastian.rueter@vti.bund.de +49 40 73962-619+49 40 73962-699 www.vti.bund.de