Download
1 / 31
340 likes | 575 Views
Geoserve Logging & Tomography. Borehole Resistivity Logging and Tomography for Mineral Exploration W. Qian, B. Milkereit, G. McDowell, K. Stevens and S. Halladay www.geo-lt.com. B. A. N. M. WHY ?. Continuities of conductors between boreholes Identification of conductors offhole

E N D
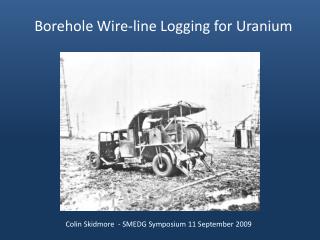
Geoserve Logging & Tomography Borehole Resistivity Logging and Tomography for Mineral Exploration W. Qian, B. Milkereit, G. McDowell, K. Stevens and S. Halladay www.geo-lt.com
B A N M WHY ? • Continuities of conductors between boreholes • Identification of conductors offhole • Mapping perfect conductors • Mapping poor conductors
B A N M WHY NOW ? • Forward modeling studies • Multi-electrode array instrumentation
Advantages of the System • Very easy to deploy • Can acquire vast amount of data rapidly • Battery power • Easy data QC • Rugged design
Ni-Cu (Super Conductor) Zn, Pb and Ag (Modest Conductor)
Vertical Resistivity Profiling A M N Apparent Resistivity B
VRP survey in a single hole will provide: • Bulk background resistivity • Information about off-hole conductors
B1 B2 Projection Plane B3
B1 B3 B2
QC Electric Current Injected between B2 and B3 Ore zone in B2 Current Electrodes in B2 Current Electrodes in B3 Deeper Deeper
QC Electric Current Injected between B2 and B3 Ore zone in B2 Current Electrodes in B2 Ore zone shadow in B3 Current Electrodes in B3 Deeper Deeper
QC Electric Current Injected between B1 and B3 Current Electrodes in B1 Ore zone shadow in B3 Current Electrodes in B3 Deeper Deeper
B1 B3 B2
Electric Current between two adjacent electrodes in B2 Top Massive Sulfide Zone Bottom
Electric Potential between two adjacent electrodes in B3 [mV] Ore zone shadow in B3 Ore zone in B2 1 mA of current is injected between two adjacent electrodes in B2
QC Electric Current Injected between B1 and B3 Zone II Zone I Deeper Deeper
No Electrode Coverage Zone II Zone I No Electrode Coverage
A: alteration bleached, no significant Zn mineralization or Pyrite-content, resistivity larger than 40 ohm.m B: brecciation, matrix Pyrite rich ( 5 – 10 % Pyrite), less than 1% Zn content, resistivity between 15 and 40 ohm.m C: strong brecciation, often more than 5% Zn content, resistivity less than 15 ohm.m.
Inverse Modeling Strategy • VRP pseudo section as starting model • Sharp inversion of only VRP data (Initial model is the main constraint) • Build a model from the two sharp inversion models • Fix the near borehole properties and let the tomography inversion work on the resistivity in the central region. The resistivity values can be fixed, semi-fixed (fixed in a narrow range) or completely floating • Fine tuning the inversion model with different geological / petrophysical constraints
Conclusions • Detect conductive zones within 30 m range around the borehole • Provide independent estimate of bulk (4 - 100 m) resistivity data • for calibration / interpretation of other EM datasets • Map conductive zones between the boreholes 180 m apart • Works for all conductivity contrasts • Very easy field operation procedures
Outlook • Field test 3D tomography methodologies • Develop IP data interpretation • Move towards simultaneous data acquisition in multiple boreholes • Build cables to deploy in deeper boreholes
Acknowledgement • Nash Creek, Slam Exploration • Sudbury, Camiro, NSERC, CVRD, Xstrata, First Nickel