
100
200. 150. New leaves and reproductive parts (g m -2 yr -1 ). 100. Control. 50. Fertilized. 0. 200. 150. New stems (g m -2 yr -1 ). 100. 50. 0. 200. 150. Secondary growth (g m -2 yr -1 ). 100. 50. 0. 1982. 1987. 1992. 1997. Year.

100
E N D
Presentation Transcript
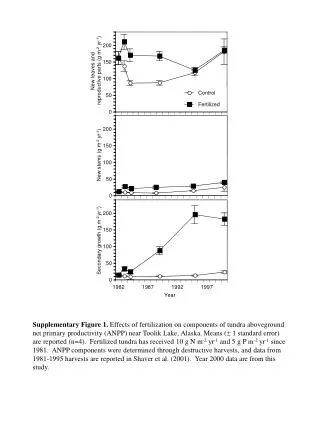
200 150 New leaves and reproductive parts (g m-2 yr-1) 100 Control 50 Fertilized 0 200 150 New stems (g m-2 yr-1) 100 50 0 200 150 Secondary growth (g m-2 yr-1) 100 50 0 1982 1987 1992 1997 Year Supplementary Figure 1. Effects of fertilization on components of tundra aboveground net primary productivity (ANPP) near Toolik Lake, Alaska. Means ( 1 standard error) are reported (n=4). Fertilized tundra has received 10 g N m-2 yr-1 and 5 g P m-2 yr-1 since 1981. ANPP components were determined through destructive harvests, and data from 1981-1995 harvests are reported in Shaver et al. (2001). Year 2000 data are from this study.


