Tim Woods
Horticulture. Tim Woods. The Horticulture Industry. Nursery Greenhouse Floriculture Landscaping and services Sod. Fruits and nuts Vegetables Grapes and wine. Kentucky Horticulture Cash Receipts. Million $. Projecting $121 2012. Agricultural Economics.

Tim Woods
E N D
Presentation Transcript
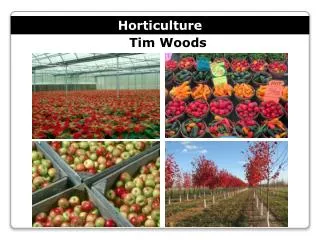
Horticulture • Tim Woods
The Horticulture Industry • Nursery • Greenhouse • Floriculture • Landscaping and services • Sod • Fruits and nuts • Vegetables • Grapes and wine
Kentucky Horticulture Cash Receipts Million $ Projecting $121 2012 Agricultural Economics
U.S. Vegetable Farm Cash Receipts Source: U.S. and State Farm Income and Wealth Statistics: Cash receipts, by commodity groups and selected commodities, 1924-2011
Tomato Imports Continue to Grow Thousand $ Source: USDA ERS, 2012
Imports as a Share of Domestic Fresh Consumption % Source: USDA ERS Vegetable and Melon Report and Fruit & Nut Report, 2011
Kentucky Produce Marketing Channels: Farms Selling More Than 10% into One Channel (2003 and 2012) Source: Kentucky Produce Marketing and Planting Intentions Survey, 2003, 2012
Growth in KY Produce Sales Activity Responses in percent of growers, first graph not including 8.1% producers not producing in 2008
Number of U.S. farmers markets up dramatically since mid-1990s U.S. Farmers Market Growth: 1994-2012 • From 1,755 in 1994 to 7,864 by 2012 • More than 5,000 new farmers markets since 2000, an increase of 175% Source: Diamond, USDA-AMS 2011; USDA AMS
Community Farmers Marketing Activity in Kentucky Source: Sharon Spencer, Kentucky Department of Agriculture; note – data is provided only for markets that provide reports. While this includes the major markets, a meaningful amount of sales activity is difficult to determine with precision.
Growing interest in local foods • KY Proud • 3200+ food businesses and markets • Restaurant Rewards • 57 restaurants in 2010 • 211 in 2012
Produce Auctions • Six auctions active in KY • 350 vendors selling in 2008, 700+ in 2012 • Growing in KY, OH, MO, PA • Regional information on “wholesale” prices • Buyers primarily resellers • Attracting order buyers from larger markets • Price reports help buyers and sellers • Flowers have become important items
2011 Regional Produce Sales Source: USDA-ERS 2012
Perspective on the Kentucky Nursery, Greenhouse and Sod IndustryCensus of Horticultural Specialties 2009
U.S. New Housing Starts: Where we came from • Thousand Homes. Annual Rate Seasonally Adjusted.
U.S. New Housing Starts Present Value & Future Projection – guarded optimism Thousand Homes. Annual Rate Seasonally Adjusted. Source: Financial Forecast Center http://www.forecasts.org/house.htm
Most Important Factors Facing Nursery Business During Next 2 Years Source: Woods, 2011 Nursery Buyers Survey
KY Horticulture Business Resources • Crop Diversification Center • http://www.uky.edu/Ag/NewCrops/ • 2011 Regional Winegrape Outlook • Farmers Market Technology Project • 2011 Regional Nursery Buyers Survey • Wholesale, auction, farm market prices • Food Systems Innovation Center • http://www.uky.edu/fsic/ • KY Food Consumer Survey • MarketReady • Additional food business development training