Download
1 / 38
420 likes | 858 Views
Radiation hardness in ITER Diagnostics. Overview of Fusion and ITER ITER Diagnostics Labyrinth shielding X-ray spectroscopy Plasma modelling Neutronics modelling Radiation-hard detectors. Robin Barnsley ITER Diagnostics Division.

E N D
Radiation hardness in ITER Diagnostics • Overview of Fusion and ITER • ITER Diagnostics • Labyrinth shielding • X-ray spectroscopy • Plasma modelling • Neutronics modelling • Radiation-hard detectors Robin Barnsley ITER Diagnostics Division
1 Magnetic confinement fusion researchD-T fusion requires lowest temperatureEin +D + T -> (4He + 3.5 MeV) + (n + 14.1 MeV)Breeding T from Li: nslow + 6Li -> 4He + T nfast + 7Li -> 4He + T + nslowEnergy multiplication, Q: Q = Pout / PinBreakeven, Q=1 Palpha + Pneutron = Pin Ignition: self-heating Palpha = Pin • Leading magnetic confinement device is the Tokamak • - Closed magnetic field minimizes particle losses • - Combined toroidal and poloidal fields produce helical field, that stabilizes +ve/-ve charged particle drifts. • Plasma current induced by inner poloidal coils. • Additional heating from neutral beams and RF/microwave • Self-heating from fusion alphas
Inside JET without and with plasma Visible radiation dominated by D near edge Core radiation mostly x-rays On JET 0.5 < Prad < 5 MW Remote-handling in-vessel since 1997
tE D-T fusion achievements to date JET (Joint European Torus), located near Oxford, England, is the largest Tokamak worldwide, and is a leading test-bed for ITER physics and technology JET has unique D-T capability • Tritium handling plant • Remote handling • Shielded torus hall • DT compatible diagnostics • Neutral beam upgrade to ~ 40 MW • Proposed to run until ITER operational For a JET D-T plasma, with 20 MW input into the plasma total output : max 16 MW Record: Q = 0.8 (JET) Steady state: Q = 0.3 (JET)
AUG JET ITER Physics performance can be extrapolated better than factor 2. Technological developments ongoing for: - First wall: blanket and divertor modules. - Material properties under heavy neutron irradiation. Scaling to ITER from previous experiments
ITER overview Participating Teams all ratified by end of 2007 China, Europe, India, Japan, Russia, South Korea, USA. Construction site: Cadarache, St Paul les-Durance, Provence, France Goals: Develop and demonstrate the physics and technology required for a fusion power plant. Construction: 10 yrs. Began in 2008 with preparation of the site Operations: 10 yrs.Hydrogen phase > Deuterium phase > Low-duty D-T > High duty D-T
R (m) 6.2 a (m) 2 VP (m3) 850 IP (MA) 15(17) Bt (T) 5.3 d,k 1.85, 0.5 Paux (MW) 40-90 Pa (MW) 80+ Q (Pfus/Pin) 10 Pfus(MW) 500 • ITER (www.iter.org) • Superconducting Tokamak • Single-null divertor • Elongated, triangular plasma • Additional heating from RF, and negative-ion neutral-beams and 1st EIROforum School on Instrumentation, CERN, 11-15 May 2009, R Barnsley
ITER cross-section 1st EIROforum School on Instrumentation, CERN, 11-15 May 2009, R Barnsley
Characteristics of the plasma radiation • Main plasma • - Fuel ions D-D or D-T are diluted by impurities. Eg 2%C, 0.1% O, 0.001% Ni. • Density ~1020 /m3 , • Te ~ 25 keV, Ti ~ 25 keV. • Optically thick > ~1mm: • - Emits and absorbs RF and microwave. • - Electrons orbiting in magnetic field • Optically thin < ~1mm. • - Emits quasi-blackbody Bremsstrahlung spectrum peaked at few keV. • - Many discrete spectral lines from fuel and impurity neutrals and ions. • Neutron and gamma emission from fusion reactions.
Passive Diagnostic Techniques Magnetics Pick-up coils B-fields, position, current, stored energy RF ~ 30MHz RF antennae Ion cyclotron emission mm-wave Waveguide Electron cyclotron emission - Te profile IR Camera Tile thermography Visible Filters, Gratings Edge impurity spectroscopy, vis. Brems Zeff VUV/XUV Grating + MCP Impurity spectroscopy, machine protection Soft x-ray camera Diode array Broadband tomography Soft x-ray survey Crystals + GPC Impurity spectroscopy, machine protection High res. X-ray Crystal + MWPC Doppler spectroscopy of Ti, bulk motion Hard x-ray Scintillators Supra-thermal electrons -ray Scintillators Fusion products C-X neutrals Mass-spec Ion dynamics Ions, electrons Langmuir probe Edge Te, Ne Wide band Bolometry Total radiated power Neutrons Imaging, counting, spectroscopy, activation
Active Diagnostic Techniques 1 MW, 1 GHz gryrotron Collective Thomson scatt. Ion dynamics mm-wave ~ 100 GHz Reflectometry Plasma position FIR DCN laser 0.2 mm Interferometer Density profile Ruby laser LIDAR Thomson Scattering Electron density and temp. Neutral beam 100 keV Charge exchange spectr. Ion temp, impurity density Lithium beam ~ 20 keV Spectroscopy Edge Te, Ne Heavy ion beam Vis spect, Mass spect E-fields Laser ablation Impurity injection Impurity transport
Diagnostics are linked to physics and operations by ITER Measurements Requirements – about 45 parameter groups. Below are some relating to Spectroscopy 1st EIROforum School on Instrumentation, CERN, 11-15 May 2009, R Barnsley
1st EIROforum School on Instrumentation, CERN, 11-15 May 2009, R Barnsley
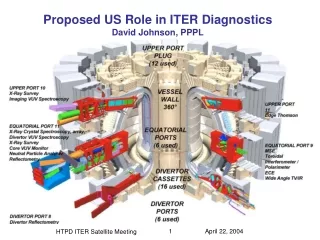
ITER diagnostics are port-based where possible Each diagnostic port-plug contains an integrated instrumentation package 1st EIROforum School on Instrumentation, CERN, 11-15 May 2009, R Barnsley
In-Vessel Distributed Diagnostics
Ports contain several diagnostics Common features: High fluxes onto plasma-facing mirrors - Nuclear radiation - 0.5 MW / m2 - Heat, peaking in x-rays - Escaping neutrals and ions Mirror/waveguide labyrinths for shielding - Require extensive neutronics analysis - Performance compromised - No fibres, lenses or windows in port Some systems cannot use labyrinths - X-ray camera, spectroscopy - Neutron and gamma cameras Some systems require vacuum extensions - VUV spectroscopy - Neutral particle analyser High electromagnetic loads - Plasma current of 15MA can disrupt in 40ms 1st EIROforum School on Instrumentation, CERN, 11-15 May 2009, R Barnsley
Radiation issues according to location 1st EIROforum School on Instrumentation, CERN, 11-15 May 2009, R Barnsley
Mirror labyrinth collection optics on ITER upper port #3 Neutronics by G.E.Shatalov, S.V.Sheludiakov, Kurchatov Inst. Moscow • The neutron environment ranges from mild behind the port-plug to severe at the blanket. • StSt:H2O 80:20, • Allowable activation • at Flange <100 uSv/hr • behind BioSh <10 uSv/hr • Normalized to 500 MW fusion power • Neutron flux at flange ~ 1. 107 n/cm2 s-1 • This is less than inside JET torus hall. • Equivalent to local dose <5 uSv/h (10 days after s/d) • Total nuclear heating power to: • BSM 420 kW • A 58 kW • B 0.43 kW • C 9W • Addition power deposition in TFC ~10W • M1 Heating ~2W/cc • Total Neutron flux ~6.1013 n/cm2 s-1
High-resolution x-ray spectroscopy Extensively, but not exclusively, He-like ions. ~Te/Z: 250eV: Ne, 500eV,:Ar, 2keV: Fe-Ni, 10keV:Kr Requires/ >~ 5000, hence < 1.3 nm for crystals Ti: Doppler broadening Vtor/pol: Doppler shift Te Dielectronic satellite ratio ne Forbidden line ratio z/(x+y) (sometimes) Zeff Continuum imp Impurity injection nimp Absolute calibration Simple and reliable - bent crystal & pos. sens. detector. Crystals are cheap dispersive elements, eg Si < 1kEur Energy resolving detector makes it doubly dispersive, with excellent signal-to-noise ratio. All crystal-window-detector processes are volume effects, leading to calculable and stable calibration. (1 mm Carbon ~ transparent at 10 keV). Detector developments have been the key to progress: 1st gen. Photographic film 2nd gen. Multiwire prop. counter, ~ 3 - 25 m radiius 3rd gen. Solid state eg CCD, 0.5 - 2 m radius 4th gen. Imaging with fast 2-d detector Te = 0.58 keV from all diel. satellites & line w; Ti = 0.45 keV ArXVII spectrum from NSTX - Manfred Bitter
High resolution imaging crystal spectrometers Recent advances in active pixel detectors such as Pilatus and Medipix have enabled a new generation of imaging crystal spectrometer. The technique has moved quickly from demonstration, to routine production of a wide range of new physics results (Matt Reinke, John Rice, this meeting) The ITER design has been based on this principle since 2003 Extensive analysis and modelling has been performed: • Plasma emission modelling • Spectrometer sensitivity and signal estimates • Neutronics analysis to optimize the forward position of detectors
Advances in detector technology enable new measurement capabilityCERN-led Medipix 3 – in development Active pixel detector - Each pixel has analog pulse processing, thresholds, and digital counter • 256 x 256 array. Pixels 55 um square - Multiple enrgy windows • 1 us pulse-process time per pixel - Radiation-hard to ~1014 neutron/cm2 Diagnostic applications • X-ray spectroscopy and imaging - Particle detection and spectroscopy • Fast visible and VUV framing (with MCP) • Neutron and gamma spectroscopy
3 PILATUS II Detectors Provide Continuous Spatial Coverage of He-like Ar Spectra C-Mod Plasma (Height =72 cm) Bottom Crystal Core Detector Top
Lower Hybrid Wave Induced Rotation on Alcator C-ModMeasured by imaging crystal spectrometer (Ken Hill et al)New measurement capability for non-NBI discharges
High resolution imaging crystal spectrometer for ITER Plasma coverage by radial views Plasma coverage by toroidal views Crystal radial • Yellow represents view tunnel within the port plug and its virtual extension into the plasma • Aim is to view the tangent to all plasma flux surfaces • Spatial coverage drives detector height Detector toroidal View from top of plug
ITER impurity line emission and spectrometer signals Top left Modelled ITER radial profiles Top right Local emissivity of impurity spectral lines (O’Mullane, ADAS-SANCO) Bottom Simulated signals for imaging x-ray crystal spectrometer Incremental radiated powers for added impurity concentrations of 10-5.ne are: Ar 0.25 MW Fe 0.8 MW Kr 1.4 MW 1st EIROforum School on Instrumentation, CERN, 11-15 May 2009, R Barnsley
Z-plane cross section of the neutron flux, modelled in Attilafinite-elementneutron transport code
Background and lifetime for a Medipix-like detector Saturation rate: 3 . 1010 /cm2 .s (106 /s per 55 um pixel) Lifetime fluence of 1 MeV neutrons: 1014 /cm2
High energy physics requires radiation-hard detectorsSLHC core neutron fluence >10^16/cm^2 over 10 yrs
KU-1 glass ITER lifetime Maintainable 1st EIROforum School on Instrumentation, CERN, 11-15 May 2009, R Barnsley
Imaging Crystal Spectrometer Layout, with overlap between upper and equatorial views
Neutron and -cameras for ITER • Radial camera • - 20 Views total • - 12 ex-vessel • - 8 in-vessel – dictated by narrow port • Vertical camera • - Required to detect in-out asymmetry • - Difficult to integrate • - Divertor location favoured • Instrumentation • - Counters and spectrometers • Fission chambers for neutrons • Scintillators for gammas and neutrons • Natural and CVD diamonds
Summary • The ITER diagnostic system deals with radiation in a number of ways: • Real hardness: waveguides, mirrors, mineral-insulated cables • Shielding: optical labyrinths, remote detectors • Use of radiation-hard detectors: x-ray spectroscopy and imaging • Neutronics modelling is essential to optimize diagnostic designs • ITER Diagnostics are entering the detailed design phase. • Construction time for a complete diagnostic system: ~ 6 yrs