Download
1 / 2
20 likes | 123 Views
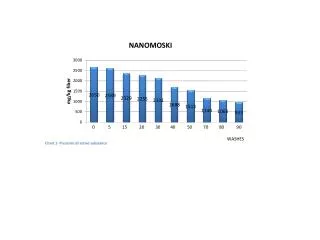
Chart 1 shows % of active substance in washes, while Chart 2 compares presence of active substances. Analyze the data effectively.

E N D
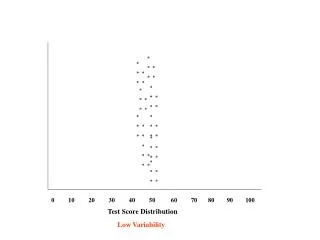
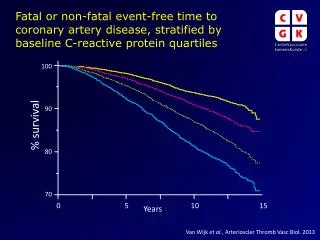
05 1520 30 40 5070 8090 • WASHES Chart 1- Presence of active substance
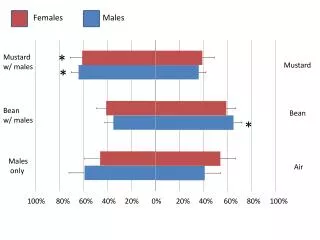
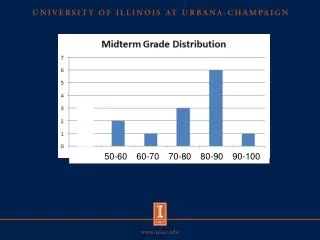
% Chart 2- Comparison of the presence of active substances