Download
1 / 29
290 likes | 383 Views
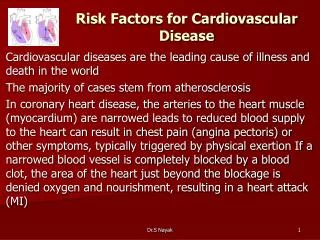
Trends in heart disease risk factors 1984-1993. Did health inequality widen?. Data sets. Health and Lifestyle Survey 1984. 9003 men and women resident in private households in England, Wales and Scotland (only England used here)

E N D
Trends in heart disease risk factors 1984-1993 Did health inequality widen?
Data sets • Health and Lifestyle Survey 1984. 9003 men and women resident in private households in England, Wales and Scotland (only England used here) • Health Survey for England 1993. 13,565 men and women resident in private households in England • Both surveys included a nurse visit to collect clinical data
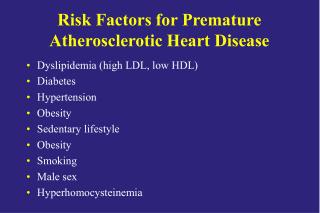
Smoking Low veg. consumption High fat milk Main bread not wholemeal Low fruit consumption No sport Body Mass Index (weight in kg/height in m2) Waist to hip ratio Systolic BP Diastolic BP Common risk measures
Self reported angina or heart disease Taking medication for high blood pressure Diabetes Self reported general health Long term illness GHQ ( a measure of mental health) Cardiovascular mortality (from other official figures, up to 1999) Outcome measures
Research questions • Did social inequality in risk factors increase between 1984 and 1993? • Did inequality in prevalence of cardiovascular health problems increase? • Were the trends in inequality in heart disease 1984-1999 consistent with the trends in risk factors?
Mean waist-to-hip ratiomen 20-64 RII 1984 = 0.013 RII 1993 = 0.018 P change = 0.42
% current smoker RII 1984 = 5.6 RII 1993 = 4.29 P change 0.18
% eating vegetables less than x1 per day R!! 1984 = 1.76 RII 1993 = 1.96 p change = 0.59
% doing no sport RII 1984 = 3.36 RII 1993 = 3.31
% with severe lack of social support RII 1984 = 1.92 RII 1993 = 2.53 p change 0.30
Were changes in risk factors accompanied by physiological changes?
Mean diastolic blood pressuremen 20-64 RII 1984 = 2.12 RII 1993 = -0.90 P change = <0.01
Mean systolic blood pressuremen 20-64 RII 1984 = 5.02 RII 1993 = 3.07 P change = 0.19
% with diabetesMen 20-64 RII 1984 = 0.62 RII 1993 = 1.66 P change = 0.14
% on drug therapy for hypertensionMen 20-64 RII 1984 = 1.12 RII 1993 = 1.53 P change = 0.48
% with self-reported angina or heart diseaseMen 20-64 DSR RII 1984 = 1.75 RII 1993 = 1.86 P change = 0.92
Potential of the Health Surveys for England • Published reports already allow long term trends in many risk factors to be seen • Next detailed data on cardiovascular disease and risk factors will be available when the data for 2003 are published
Has health inequality decreased since the mid-1990s?? • Preliminary look at HSE 2001 • Not intended as a study of adult cardiovascular disease • Rather small numbers in the relevant age groups
Ischaemic heart disease mortality trends 1986-1999 • Use the older “Registrar-General” social classification for ease of comparison • Have been compiled using “linked” data from the ONS Longitudinal Study • Slightly older age group than that used for the trends in risk factors [35-64]
Ratios 1986- 1.69 1993- 2.22 1997- 1.86 Source: White et al. Health Statistics Quarterly, 2003