Download
1 / 30
300 likes | 317 Views
This talk explores the use of visualizing, interacting with, and animating flow in complex networks, using the metaphor of pipes. It discusses the scaling up of flow visualization in citation and hats data, as well as the emerging semantics and provenance of such visualizations. Examples of motion-based visualizations for relational spatio-temporal data are presented, highlighting the benefits of using physical analogies. The talk also discusses the potential impact for analysts in various domains.

E N D
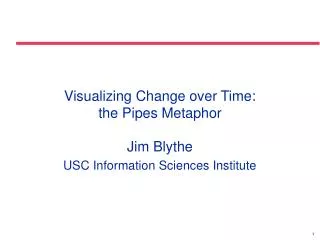
Visualizing Change over Time:the Pipes Metaphor Jim Blythe USC Information Sciences Institute
Talk outline • Why pipes?? • Visualizing, interacting with and animating flow. • Scaling up: flow in citation and hats data with 1m nodes+links • The emerging semantics/provenance of a visualization • Wrap-up
Motion-based visualizationfor relational spatio-temporal (RST) data • Motion is a natural tool for visualizing RST data • Draws human attention to change in complex data • Can reflect temporal aspects directly • Natural way to provide feedback on analyst ‘what-if’ tests • Interaction essential to avoid false impressions due to dimension reduction. • But we don’t yet have a theory or conventions for using motion in network visualizations • Users interpret visual cues in rigid ways, both from cognitive aspects and via a rich set of pre-established conventions • Fewer experimental results for motion (but see work by Ware and others)
Our solution: visualizations based on physical analogies • By appealing to well-known physical analogies, provide interpretable images and ways to interact with the data. • Users will bring expectations about how to interpret observed motion and change • Examples studied: fluid flow through elastic pipes and wave motion through a graph
Why pipes?? Fluid flow in pipes is a simple and common model , not fully exploited for interacting with networks. • Everyone is familiar with it: intuitive and powerful • Provides natural interactions with a network • Puts focus on links, rather than well-studied nodes • A general method – for oil/gas, money, information or ideas, actual or max flow, ..
Impact for analysts • Facilitate what-if testing of actions on networks • Bring computed network properties to life through interaction with fast feedback • Facilitate understanding of observed and possible future dynamics of underlying system • Draw attention to widely distributed effects of action as network changes • Enable rapid identification of relevant data, regardless of how they are distributed relationally, spatially, or temporally • General techniques that can be applied to, e.g., disease outbreaks, terrorist networks, flow of money
Talk outline • Why pipes?? • Visualizing, interacting with and animating flow. • Scaling up: flow in citation and hats data with 1m nodes+links • The emerging semantics/provenance of a visualization • Wrap-up
Example: trade in widgets Links show capacities. E.g. “What is the greatest number of widgets F can receive from A and B?” 9 3 2 Standard max flow problems are easy to solve, but are NP-hard if e.g. probabilities are involved. 3 3 3
Simple use of pipes 2-d ‘pipe’ shows capacity and flow. Red shows flow. Black shows unused capacity. 9 If I must remove one link, which has the least effect? The greatest? Min cut 5 3 2 3 3 3 If I can increase one link in capacity, which should I choose? 2
Scaling up: satellite data on oil and gas pipelines • ~3000 nodes, 3000 links, each with up to 80 line segments • Flow updated ~50 times per second (on 1.6 GHz centrino, 512M RAM) • Helps users pinpoint areas most vulnerable to attack, or high-payoff areas to improve capacity in real time. • See our demo.
Generic action API for 3rd-party code Users can • Add and modify nodes, links and capacities • Set node properties, e.g. source, sink, … • Temporarily block nodes and links 3rd-party systems can • Declare node or link properties of interest • Register for user modifications • Provide updated data on links and nodes
Talk outline • Why pipes?? • Visualizing, interacting with and animating flow. • Scaling up: flow in citation and hats data with 1m nodes+links • The emerging semantics/provenance of a visualization • Wrap-up
Scaling up: Cora publication dataset • Dataset of citations with 220k nodes and 700k links • 32k papers have year, title, journal/conference • Links are ‘person a is an author of paper b’, or ‘paper a cites paper b’ • Complete graph loads in seconds in KrackPlot. • Define filters and graph manipulations for visualization on the fly.
Timeline view of single author 1992: Author moves from CMU to ISI
Flow applications in publication data • Identify keywords or key phrases in part of the text • Have access to title in CORA • Visualize flow from paper to citing paper when rare phrases are repeated • Uncover influence between individuals and communities, or track the emergence of a sub-field
Provenance and semantics of a visualization A number of manipulations must be choreographed to create the most useful visualizations • Some are at data/filtering level – what entities are shown as nodes and as links • Some are at the visual level – assigning visual cues to properties of the data Together they form the provenance, or semantics, of the visualization When another viewer sees the visualization, they will need to know the semantics to understand it
Example from timeline display Goal: Show co-authors and co-citations on a timeline for “name” Actions required to create timeline display: Search $name -> $node display only current selection show neighborhood size 2 around $node unselect $node add child links define nbrhd "focal + children + parents|entity=person“ around $node map year to time in anneal layout lay out by annealing show classification as color and shape
Maintaining provenance to create shareable visualizations – and reusing them The visual system captures the user’s actions and generalizes them by analyzing dependencies Allows replay on other points of interest - e.g. a new reusable process to visualize author timelines Can be encapsulated with the visualization to provide provenance - another viewer can inspect the filtering and visual cues used
Hats output datasets Tested loading of output with 20k hats and ~ 1.3million links Interesting sequences of meetings can be viewed as a flow of capabilities
Impact for analysts • Facilitate what-if testing of actions on networks • Bring computed network properties to life through interaction with fast feedback • Facilitate understanding of observed and possible future dynamics of underlying system • Draw attention to widely distributed effects of action as network changes • Enable rapid identification of relevant data, regardless of how they are distributed relationally, spatially, or temporally • General techniques that can be applied to, e.g., disease outbreaks, terrorist networks, flow of money
Highlighting change Motion: • Node/link motion to reflect structural change • Highlighting links: moving bulges, links that fade, radiate, wiggle or flash Static: • Show the difference with overlays using color, background shading, … Build on our work on motion in social network viz [McGrath & Blythe 04] and work in general viz [Bartram et al 01].
Status and future work • Completed tasks on initial animation and interaction • Defining user tasks to test utility – uncover vulnerabilities or leverage points in flow • Or discover influential actors in publication space • Next tasks: use animations to show consequences of interaction or change in structure over time. • Push on interesting ideas on emerging semantics of visualizations in collaborative environments.