Download

1 / 36
360 likes | 374 Views
Join the seminar by Gary Jedlovec, NASA/MSFC and SPoRT colleagues, to learn about the applications of Suomi NPP satellite data for weather/climate observations and critical environmental data from the polar orbit.

E N D
SPoRT Applications of Suomi NPP Data a seminar by Gary Jedlovec, NASA / MSFC and SPoRT colleagues Matt Smith, UAH / ITSC Andrew Molthan, NASA / MSFC Frank Lafontaine, Raytheon Kevin McGrath, Jacobs Bob Atkinson, USRA Additional charts from Mitch Goldberg, NOAA JPSS Program Scientist Photos courtesy of Ben Cooper
The Suomi National Polar-orbiting Partnership (NPP) satellite was launched by NASA on October 28, 2011 from Vandenburg Air Force Base Link to Launch Video (http://www.youtube.com/watch?v=q4GVaafENPs&feature=youtu.be ) http://library.ssec.wisc.edu/SuomiWebsite/index.html
NPP and JPSS JPSS-1 Satellite • Suomi NPP is the first satellite in the Joint (NOAA/NASA) Polar-orbiting Satellite Series (JPSS), formerly NPOESS • Maintains continuity of weather/climate observations and critical environmental data from the polar orbit • NOAA – JPSS provides improved continuity for POES • HIRS > CrIS • AMSU > ATMS • AVHRR > VIIRS • SBUV2 > OMPS • NASA – JPSS provides continuity for EOS • AIRS > CrIS • AMSU > ATMS • MODIS > VIIRS • OMI > OMPS • CERES > CERES Modified NOAA Chart
NPP/JPSS Instruments Modified NOAA Chart Joint Polar Satellite System 4
NOAA Operational Polar Program MetOp-A MetOp-B MetOp-C Modified NOAA Chart EPS-SG NOAA-19 NPP JPSS-1 JPSS-2 Terra Aqua 5 Joint Polar Satellite System
NPP / JPSS Derived Products EDRs with Key Performance Parameters KEY VIIRS (22) ALBEDO (SURFACE) CLOUD BASE HEIGHT CLOUD COVER/LAYERS CLOUD EFFECTIVE PART SIZE CLOUD OPTICAL THICKNESS CLOUD TOP HEIGHT CLOUD TOP PRESSURE CLOUD TOP TEMPERATURE ICE SURFACE TEMPERATURE NET HEAT FLUX OCEAN COLOR/CHLOROPHYLL SUSPENDED MATTER VEGETATION INDEX AEROSOL OPTICAL THICKNESS AEROSOL PARTICLE SIZE ACTIVE FIRES IMAGERY SEA ICE CHARACTERIZATION SNOW COVER SEA SURFACE TEMPERATURE LAND SURFACE TEMP SURFACE TYPE CrIS/ATMS (3) ATM VERT MOIST PROFILE ATM VERT TEMP PROFILE PRESSURE (SURFACE/PROFILE) ESPC GCOM AMSR-2 (11) OMPS (2) CLOUD LIQUID WATER PRECIPITATION TYPE/RATE PRECIPITABLE WATER SEA SURFACE WINDS SPEED SOIL MOISTURE SNOW WATER EQUIVALENT IMAGERY SEA ICE CHARACTERIZATION SNOW COVER/DEPTH SEA SURFACE TEMPERATURE SURFACE TYPE O3 TOTAL COLUMN O3 NADIR PROFILE CERES (4) DOWN LW RADIATION (SFC) DOWN SW RADIATION (SFC) NET SOLAR RADIATION (TOA) OUTGOING LW RADIATION (TOA) Modified NOAA Chart JPSS-1 GCOM Joint Polar Satellite System 6
Cross-Track Infrared Sounder (CrIS) NPP/JPSS CrIS • Michelson Interferometer: 0.625,1.25, 2.5cm-1 (resolving power of 1000) • Spectral range: 660-2600 cm-1 • 3 x 3 HdCdTe focal plane passively cooled • (4-stages) to 85K • Focal plane 27 detectors, 1305 spectral channels • 310 K Blackbody and space view • provides radiometric calibration • NEDT ranges from 0.05 K to 0. 5 K AIRS IASI CrIS Modified NOAA Chart “CrIS LW Noise << AIRS & IASI LW Noise” 7
Advanced Technology Microwave Sounder (ATMS) • Description • Purpose: In conjunction with CrIS, global observations of temperature and moisture profiles at high temporal resolution (~ daily). • Predecessor Instruments: AMSU A1 / A2, MHS • Approach: Scanning passive microwave radiometer • 22 channels (23GHz - 183GHz) • Swath width: 2600 km • Co-registration: with CrIS Modified NOAA Chart
CrIS / ATMS - Temperature and Humidity 20 Jan 2012 Modified NOAA Chart 9
TPW T WV RR NOAA ATMS Products Modified NOAA Chart Courtesy of Sid Boukabara (STAR)
Visible Infrared Imaging Radiometer Suite (VIIRS) Description • Purpose: Global observations of land, ocean, & atmosphere parameters at high temporal resolution (~ daily) • Predecessor Instruments: AVHRR, OLS, MODIS, SeaWiFS • Approach: Multi-spectral scanning radiometer (22 bands between 0.4 µm and 12 µm) 12-bit quantization • Swath width: 3000 km • Spatial Resolution • 16 bands at 750m • 5 bands at 325m • DNB Modified NOAA Chart VIIRS on NPP
VIIRS Prelaunch Performance Modified NOAA Chart Courtesy of H. Oudrari
Heritage Capabilities VIIRS DNB MODIS SeaWiFS AVHRR Ozone WV OLS Low Light Imagery 0.4 0.5 0.6 0.7 0.8 0.9 1.2 1.8 2.4 4 6 8 10 12 14 Modified NOAA Chart Breaks in scale Visible Mid wave IR Long wave IR [micron] 13 Credit: Northrup Grumman & Raytheon
Spatial Resolution Comparisons Northrup Grumman & Raytheon Modified NOAA Chart Because of aggregation VIIRS has much better resolution away from nadir, pixel area 8 times smaller than AVHRR or MODIS 14
MODIS -/ VIIRS Comparison MODIS VIIRS True color - Northeast US Modified NOAA Chart 15
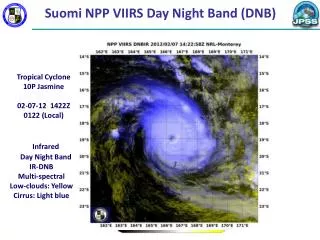
VIIRS Day Night Band Chicago Atlanta Dallas Miami New Orleans Modified NOAA Chart
OMPS Instrument Design Nadir Mapper UV Backscatter, grating spectrometer, 2-D CCD TOMS, SBUV(/2), GOME(-2), OMI 110 deg. cross track, 300 to 380 nm spectral, 1.1nm FWHM bandpass Total Column Ozone, UV Effective Reflectivity, and Aerosol Index Daily Maps Nadir Profiler UV Backscatter, grating spectrometer, 2-D CCD SBUV(/2), GOME(-2), OMI Nadir view, 250 km cross track, 270 to 310 nm spectral, 1.1 nm FWHM bandpass Ozone Vertical Profile, 7 to 10 km resolution Limb Profiler UV/Visible Limb Scatter, prism, 2-D CCD array SOLSE/LORE, OSIRIS, SAGE III, SCIAMACHY Three 100-KM vertical slits, 290 to 1000 nm spectral Ozone Vertical Profile, 3 KM vertical resolution Solar diffusers used in calibration Instrument and FOV graphics from BATC Modified NOAA Chart
Ozone Profile and OMPS Limb Modified NOAA Chart Photo taken from ISS
CERES Instrument Overview Primary CERES Climate Data Records Reflected Solar Energy Emitted Thermal Energy 21 in. CERES scanning radiometer measuring three spectral bands at TOA • Total (0.3 to >50 m) • Shortwave (0.3 to 5.0m) • Longwave (5 to 50m) Operations, Data Processing, Products, and Science are a continuation of experience developed on • TRMM (1), EOS Terra (2), EOS Aqua (2), in I&T on NPP 18 in. 22 in. Modified NOAA Chart
Earth Radiation Budget CERES Shortwave TSIS CERES Longwave From IPCC AR4 FAQ Modified NOAA Chart
Application of Suomi NPP Data JPSS-1 Satellite NOAA / NESDIS JPSS program asked SPoRT for help with the following activities: • Sustain user engagement • Demonstrate importance of NPP data to the Nation and to critical operational product and services and for improved research • Established a JPSS Proving Ground to focus on improved utilization of NPP/JPSS data for key application areas • Integrate NPP data into the operational environment
SPoRT is focused on transitioning unique NASA observations and research capabilities to the operational weather community to improve short-term weather forecasts on a regional and local scale. • Initially worked with WFOs in Southern Region • SPoRT activities began in 2002 and the first products to AWIPS in February 2003 • SPoRT Paradigm • Match observations to forecast challenges • Develop and assess solution in “testbed” environment • Transition solution to decision support system • Develop/conduct training, product assessment and impact • Benefit • Demonstrate capability of NASA experimental products to weather applications and societal benefit • Prepares forecasters for use of data from next generation of operational satellites (NPP/JPSS, GOES-R) Short-term Prediction Research and Transition (SPoRT)
Partnered with NOAA / University community • Access to real-time experimental • data / products • NASA instruments data and • model products • Collaborations with NOAA CIs • for GOES-R proxy products • End users • Regular interactions with 20 WFOs • National Centers and “testbeds” • Private sector users • Data / transition / dissemination • Suite of over 30 satellite derived products, analyses, forecast products • Public ftp, Local Data Manager (LDM) • AWIPS, NAWIPS, AWIPS2, Google Earth, EVCM Partnerships and End Users “SPoRT” WFOs Regional HQs Collaborating National Centers Data providers / subject matter experts
SPoRT Focus with NPP • Initially focusing on VIIRS, SPoRT is • using established partnerships for data access and for data disseminate to various WFOs • engaging forecasters in an evaluation of selected products to address specific forecast challenges • demonstrating capabilities in AWIPS / AWIPS II • In the CONUS region, the primary focus is on products which address challenging forecast issues related to convective storm diagnostics, reduction in visibility and ceilings, and unpredicted variations in regional weather due to local surface forcing • In OCONUS, atmospheric and cloud products are being evaluated to address nowcasting issues with additional emphasis on ocean products, particularly SST, ocean color, ice characterization, and snow cover
VIIRS Products for WFOs • Scientific Data Records (SDRs) – basic channel imagery – wider swath, preserved resolution on edge of scan • Derived red-green-blue (RGB) color composites for the detection of atmospheric and surface features - several standard RGB composites shown by EUMETSAT and others to be of significant value in diagnostic weather analysis. • dust detection, air mass, and convective storms • day and night-time microphysical imagery • natural and false color images (surface features) • The low light visible channel can address snow cover, airborne dust, smoke and clouds, city lights, fires and lightning at night. • Environmental Data Records (EDRs) and NOAA Unique Products (NUPs) provide derived products to address specific forecast issues – only some may be available in real time
VIIRS Products in AWIPS / AWIPS II D2D in AWIPS CAVE in AWIPS II VIIRS imagery in Decision Support Systems (DSS) at various WFOs
VIIRS Products for WFOs • Scientific Data Records (SDRs) – basic channel imagery – wider swath, preserved resolution on edge of scan • Derived red-green-blue (RGB) color composites for the detection of atmospheric and surface features- several standard RGB composites shown by EUMETSAT and others to be of significant value in diagnostic weather analysis. • dust detection, air mass, and convective storms • day and night-time microphysical imagery • natural and false color images (surface features) • The low light visible channel can address snow cover, airborne dust, smoke and clouds, city lights, fires and lightning at night. • Environmental Data Records (EDRs) and NOAA Unique Products (NUPs) provide derived products to address specific forecast issues – only some may be available in real time
RGB Products Cx, Cy, Cz are corresponding channels from CrIS
Air Mass Product Figure 2: This MODIS (Aqua) RGB Airmass image is two hours earlier (1910z on 03/02/12) and shows greater detail in regards to the drying behind the frontal band. This dry air looks to be part of a larger dry punch that originates from lower in the atmosphere, but may also contain some dry stratospheric air (highlighted in the larger red area). Note the extra dry surge that precedes the frontal band (smaller red area) that was associated with earlier supercells that caused significant tornado damage in parts of southern TN and northern AL. Although we only get a few MODIS passes a day, this product is definitely showing much more detail than the GOES-Sounder product. From the Wide World of SPoRT blog (http://nasasport.wordpress.com)
VIIRS / CrIS Air Mass RGB Products VIIRS / CrIS -- AIR MASS RGB MODIS -- AIR MASS RGB April 3, 2012 0807-0815UTC
VIIRS Products for WFOs • Scientific Data Records (SDRs) – basic channel imagery – wider swath, preserved resolution on edge of scan • Derived red-green-blue (RGB) color composites for the detection of atmospheric and surface features - several standard RGB composites shown by EUMETSAT and others to be of significant value in diagnostic weather analysis. • dust detection, air mass, and convective storms • day and night-time microphysical imagery • natural and false color images (surface features) • The low light visible channel can address snow cover, airborne dust, smoke and clouds, city lights, fires and lightning at night. • Environmental Data Records (EDRs) and NOAA Unique Products (NUPs) provide derived products to address specific forecast issues – only some may be available in real time
VIIRS Day Night Band (DNB) • Low light sensor “sees” emission from light sources • cities • lightning • fires • moonlight reflected from atmospheric and surface features • clouds • fog • snow • other reflective surfaces
Status of Activities • Reformatted sample VIIRS imagery and selected products for use in AWIPS / AWIPS II • continue to work issues with image display • product generation – hybrid, RGBs, etc. • Established procedures to disseminate products to end users in place • Direct broadcast capabilities for NPP instruments not routinely available • latency of data 10-16 hours • limited utility of delayed data for WFOs • Evaluation partners (WFOs) ready to receive data • Working to develop training • Product assessment / impact when data flows to WFOs
Future Activities • Refine / enhance / add VIIRS imagery and products to selected end users • Access and disseminate additional EDRs and NUPs for forecaster evaluation • Address additional forecast issues through the use of other NPP sensors • use real time ozone mapping with OMPS / CrIS (like currently with AIRS) to better understand storm dynamics • assimilate CrIS / ATMS temperature and moisture profiles along with AIRS / IASI data for short-term forecast improvement / atmospheric moisture processes • Expand end users to include National Centers
Summary First VIIRS image. Courtesy of the UW / SSEC. Suomi NPP instruments offer exciting opportunity for operational weather community, enhancing capabilities from previous sensor systems Extends NASA capabilities beyond Terra / Aqua for climate research and applications to benefit society SPoRT leading the way to get this new data in front of forecasters transitioning unique NASA data and research technologies to operations