Market Risk
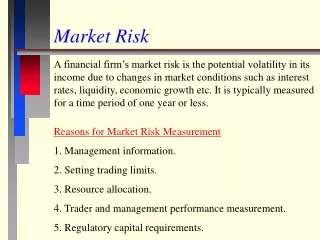
Market Risk. A financial firm’s market risk is the potential volatility in its income due to changes in market conditions such as interest rates, liquidity, economic growth etc. It is typically measured for a time period of one year or less. Reasons for Market Risk Measurement


Market Risk
E N D
Presentation Transcript
Market Risk A financial firm’s market risk is the potential volatility in its income due to changes in market conditions such as interest rates, liquidity, economic growth etc. It is typically measured for a time period of one year or less. Reasons for Market Risk Measurement 1. Management information. 2. Setting trading limits. 3. Resource allocation. 4. Trader and management performance measurement. 5. Regulatory capital requirements.
Value at Risk (VAR) • Often, financial firms want to calculate the amount of money they might lose in a day or over a given period. They use the information to avoid liquidity, solvency and regulatory problems. There are many ways to calculate VAR. We cover the most precise or widely-used methods. • 1. Risk Metrics - Steps to calculate VAR • Find the dollar value of each asset or liability position. • Find the standard deviation of each position’s percent daily price change. • Assume a confidence band, typically 95% or 1.65s. • Multiply the three numbers above for each position. • Calculate correlations between positions and combine. • VAR for more than one day = (daily VAR) (days).5.
Fixed Income Market Risk 1. Assume you own a zero-coupon bond with a 7-year maturity, $1,000,000 market value and a 7.243% yield. 2. Find its modified duration = Duration/(1+Y) = 7/1.07234 = 6.527 Assume yields move daily by .0001 on average then Standard Deviation = 6.527(.0001) = .0006527 3. Assume 95% confidence so price volatility = 1.65(.0006527) = .01077 4. Daily VAR = $1,000,000(.01077) = $10,770 5. VAR over 5 days = $10,770 (5).5 = $24,082
Equity Market Risk 1. Assume you have a well-diversified $500,000 portfolio of stocks. 2. Assume the portfolio has a beta of 2 and that the market portfolio’s return has a daily standard deviation of 2%. Portfolio standard deviation = (Beta)(Market Stand. Dev.) = 2(.02) = .04 3. Assume 95% confidence so Price volatility = .04(1.65) = .066 4. Daily VAR = $500,000(.066) = $33,000 5. VAR over 5 days = $33,000 (5).5 = $73,790
Foreign Exchange Risk 1. Assume you have a 1.6 million Swiss Francs and the exchange rate is 0.625 dollars per Swiss Franc. Position value in dollars = 1,600,000(0.625) = $1,000,000 2. Assume the the daily standard deviation in the exchange rate is .00565. 3. Assume 95% confidence so Price volatility = .00565(1.65) = .00932 4. Daily VAR = $1,000,000(.00932) = $9,320 5. VAR over 5 days = $9,320 (5).5 = $20,840
Combined (Portfolio) Risk To get the combined risk for the three positions together, we need to find the correlations of the three assets. Assume that the correlation between the bond and the Franc is (r = -.2), between the bond and the stock portfolio is (r = .4), and between the Franc and the stock portfolio is (r = .1). Then using the definition of a portfolio standard deviation VAR(portfolio)= [Si (VARi)2 + Si Sj 2corrij(VARi)(VARj)].5 we get Combined Daily VAR = [ (10,770)2 + (33,000)2 + (9,320)2 + (2(-.2)(10,770)(9,320)) + (2(.4)(10,770)(33,000)) + (2(.1)(9,320)(33,000))].5 = $39,969 VAR(portfolio) over 5 days = $39,969 (5).5 = $89,373
Interpretation • Because the positions are not perfectly correlated, the combined VAR is smaller than the sum of individual VARs. • Final portfolio result is a single number - the firm’s “Value at Risk”, which measures how much the value would change if its positions’ prices undergo a large change. • If the portfolio VAR is within acceptable limits, the firm does nothing. If it is outside the bounds it deems acceptable because of capital requirements etc., it will take action by reducing exposure to one or more of the factors. • Question: If the firm above wanted to reduce its VAR, how could it accomplish this? • See www.riskmetrics.com for examples.
Alternatives to VAR The VAR measure has been criticized mainly because it assumes price changes are normally distributed and for some assets this is not true. One alternative that does not assume normal price changes is Back Simulation. This method takes a firm’s current position values and revalues them using percent price changes observed for each type of asset for each of 500 days in the past. Now we have 500 values for the portfolio assuming the types of changes that actually occurred in the recent past. This gives us a range of values and from which we can determine the 25 (5%) largest negative value changes. Monte Carlo simulation and the BIS regulatory models are alternative that require more specialized information.
Regression Method • One problem with all of the previous methods is that they assume that we know all the positions. Finding the true net positions can be difficult sometimes. For example, suppose an insurance company owns bonds to back its life insurance policies but also has an under-funded defined-benefit pension plan. If may include the bond risk but ignore the fact that the under-funded plan is equivalent to being short bonds. • One way to get an idea of the firm’s net risk is to assume that the stock market accurately prices its stock to reflect the net risk it faces for various types of risk. • Like the other methods, we still need to determine the types of risk exposure faced by the firm - perhaps from financial statements.
Regression Method Assume that we think the factors affecting the firm’s percent stock return (Rt) is the percent changes in the general stock market (SP500t), the 3 Month vs. 30 Year Treasury Bond Spread (TBt), the Baa-Aaa yield spread (BAt), the dollar exchange rate (FXt), and the money supply (MSt). A regression of the firm’s stock returns on these factors is • The regression coefficients measure the sensitivity of the firm’s value to the various types of risk exposure. • A large positive (negative) coefficient indicates a substantial positive (negative) effect of a factor change on a firm’s value. • Useful coefficients are statistically significant (T-statistic > 2).
Regression Example Suppose we run the regression for Husky Financial with the following results (T-statistics below coefficients) R = 0.0003 + 0.871(D%S&P) + 1.124(D% TB) (1.35) (9.87) (5.52) -0.062(D% FX) + 0.007(D% BA) + 0.013(D% MS) (2.47) (0.92) (0.01) These results show that Husky’s equity value is significantly positively related to stock market return and Treasury spread but significantly negatively related to changes in the dollar. Baa-Aaa spread and money supply changes have no effect. Question: Can you explain these results?
How to Use Regression for Risk Analysis Besides showing which risks the firm is significantly exposed to, we can use the results to eliminate some risk. Example: Suppose Husky has 1 million shares that trade for $50 per share and we wish to eliminate half of its Treasury spread risk over the next month. Assume that a spread contract price changes by less than 10 percent during a month 95% of the time. 1. Equity value = $50(1,000,000) = $50,000,000 2. DEquity = 1.124(0.10) $50,000,000 = $5,602,000 3. To eliminate half the risk, sell spread contracts. How much? .5($5,602,000) = (0.10)X => X = $28,010,000
Interchangeable Risk • Note that from the regression perspective, risk is interchangeable. That is, risk is measured by stock value changes and any of the significant risks can be manipulated to reduce stock value changes. • It may be easier (cheaper) to reduce stock risk by selling the SP500 than selling Spread contracts if our goal is to eliminate a certain amount of risk rather than a particular type of risk.