Download
1 / 8
80 likes | 82 Views
This presentation discusses the phenomenon of "discrepant, competing estimates" measured by different agencies or programs, which may differ in level or long-term trend. It explores the confusion it causes among users and the need for clarity and guidance in data interpretation. Various interventions and strategies are presented to address this issue and improve data navigation for users.

E N D
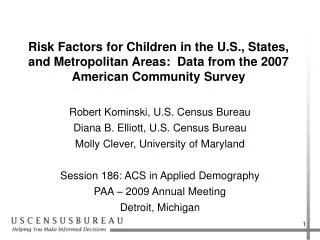
The Reality of Dueling EstimatesDeborah H. GriffinU.S. Census Bureau Presented at the Federal Committee on Statistical Methodology 2012 Statistical Policy Seminar Any views expressed are those of the author and not necessarily those of the U.S. Census Bureau.
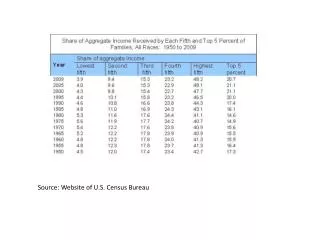
“Discrepant, Competing Estimates” Cork and Cohen (2005) • Defined “discrepant, competing estimates” as social and economic phenomena measured by different agencies or programs that may differ in level or long-term trend • Predicted in 2011 that multiple poverty measures would exist from varying sources
The Problem • Confusion by users about which estimate to use and why multiple estimates exist • Suspicion that only one can be correct if they differ • Little progress made by federal agencies in providing acceptable responses
Options Across Survey Lifecycle - Design Stage • Cross program development and testing of questions • Collaborative research on frames, data collection and data processing methods • Use of common definitions
Options Across Survey Lifecycle - Dissemination Stage • Cross agency reviews and briefings • User education • Release restrictions • Clarity in presentation • Official guidance
Goal • Raise awareness of the issue • Share opportunities and challenges associated with various interventions • Encourage actions to help data users better navigate federal statistics
Next Steps • FCSM identified an exploratory subcommittee on this issue • Feedback in this session can guide this subcommittee’s planning efforts