Download
1 / 37
370 likes | 445 Views
Discover valuable insights on trade flows, tariffs, market shares, and more with Trade Map, an interactive web-based trade flow analysis tool. Target specific countries, analyze barriers, and explore top export products effortlessly.

E N D
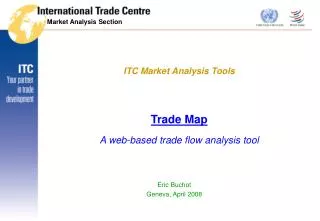
Market Analysis Section ITC Market Analysis Tools Trade MapA web-based trade flow analysis tool Eric Buchot Geneva, April 2008
An exporter of pineapples is looking to diversify its client base….. Which country should be targeted?
A dried fruit exporter needs an overview of trade barriers he/she would face for exports to Malaysia…
A trade mission needs to know our top export products to Germany…
Where could you import automotive components from? Who are the largest suppliers in your region?
What is the current trade between your country and the United States?
Initial answers to these questions and many more are easily found in Trade Map…
ITC Trade Map provides: • On-line database of trade flows • Value of exports and imports • Quantities • Trade Balance • Unit Values • Growth trends • Tariff barriers • Market shares • Rankings for all these criteria For each product and partner country in a fully interactive environment
Key characteristics • Where does the data come from? • COMTRADE, produced by the United Nations Statistics Division database • National Authorities • What is Trade Map’s geographical coverage? • Information for over 220 countries and territories using data reported by 160 countries and territories • We have data for non-reporting countries using mirror statistics • What is Trade Map’s product coverage? • For the Harmonized System • over 5,300 products at the 6 digit level • For the National Tariff Line • up to 30,000 products for 90 countries (~84% of world trade) • What is Trade Map’s time horizon? • Yearly, quarterly and monthly data
HS-2 HS-4 HS-6 Data classification - I • The Harmonized System (HS) • A numerical classification system of products used as a basis for international trade statistics by almost all countries. • The system is harmonized up to six digits (HS-6) • HS data is standardised internationally. You can compare HS data between countries. • The HS is broken down into 3 clusters: • HS-2: the chapter of the good (sector) • E.g. 09 = Coffee, Tea, Mate and Spices • HS-4: groupings within the chapter (sub-sector) • E.g. 0902 = Tea, whether or not flavoured • HS-6: product(s) within the grouping (product level) • E.g. 090210 = Green tea (not fermented) More and more specific
Harmonized System –broad product coverage, harmonised across countries • 08 (HS-2) Edible fruit and nuts; peel of citrus fruits or melons • 0804 (HS-4) Dates, figs, pineapples, avocados, guavas, mangoes and mangosteens, fresh or dried • 080450 (HS-6) Guavas, mangoes and mangosteens, fresh or dried • National Tariff Line – very specific product coverage, international comparison not possible, differentiated between countries • National Tariff Line for Australia • 08045000 (NTL) Fresh or dried guavas, mangoes and mangosteens • National Tariff Line for Japan • 080450011 (NTL) Mangoes, fresh • 080450019 (NTL) Guavas and mangosteens, fresh • National Tariff Line for the United States • 0804508000 (NTL) Guavas, mangoes and mangosteens, dried • 0804506080 (NTL) Guavas and mangosteens, fresh, if entered during the period from June 1 to august 31, of the following year, inclusive • 0804504040 (NTL) Mangoes, fresh, if entered during the period from September 1, in any year, to the following may 31, inclusive
Trade Map home page Click here to create your account Log-in Access other ITC market analysis tools
Trade Map selection menu Imports or Exports Product selection Country/Region selection Partner country selection Data visualisation
World importers of pineapples Growth rates Countries Value Quantity Global market share Unit Value Tariff Barriers
Assess the competition in export markets Assess Netherlands’ tariff barriers
Gauge your relative export performance World exporters of pineapples
Countries importing mangoes (080450) tariff line level information for selected markets
Mangoes imported by Japan at the tariff line level At the 9 digit level
Countries exporting mangoes to Japan 9 digit level information
8 or 10 digit level Markets importing “perfume and toilet waters” (330300) from France
List of products at the tariff line level 8 digit level
8 digit level Importing markets for « toilet waters » at NTL level
Analyse potential for bilateral trade Select your countries/regions
Existing and potential trade between Tanzania and United Kingdom By product groups at the HS 2 digit level
Existing and potential trade between Tanzania and United Kingdom at the HS 6 digit level
Trade Map Graphs Bubble Charts: Positioning products according to growth rates and changes in market share
Size is proportional to the turnover of the Strategic Branch Unit High Baby biscuits Market Growth Low Low High Portfolio model of a production strategy Babies - ?? Stars Organic biscuits Product Life Cycle Dogs Cash cows Chocolate Relative Market Share The Boston Consulting Model (or Matrix)
Positive International demand: World Trade Growth Negative Losses Gains National Export Growth vs. International Demand The Case of Ecuador Size is proportional to export turnover Underachievers Champions Tuna, canned Bananas Losers in declining markets Achievers in adversity Shrimps, prawns Change in world market share www.intracen.org / Click on Countries / Select your country / Click on National Export Performance
Trade Map Chart: Performance position of a country’s export products Growth in demand (of world or of a target market) HS 4 or 6 Growth in County X’s Market Share Prospects for Product Diversification Country X
Trade Map Chart: Performance position of a country’s export products
Trade Map Chart: Prospects for market diversification Growth in partner country demand for product Z Partner country Partner country share of Country X’s export of product Z Partner country Country X, Product Z
TradeMap helps Trade Support Institutions, Exporters and Importers….. • Search for new markets or suppliers • Assess competition or diversify sources • Benchmark their trade performance • Set priority products for trade promotion and development • Evaluate tariffs and trade barriers • Assess product diversification potential with a partner country
To conclude… Trade Map is: an easy to use, intuitive tool facilitating your market research.
For additional information on Trade Map Visit www.trademap.org or contact trademap@intracen.org