Download
1 / 17
170 likes | 277 Views
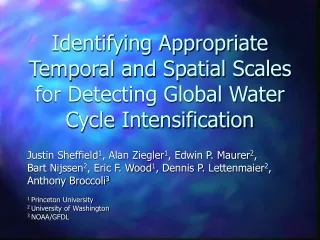
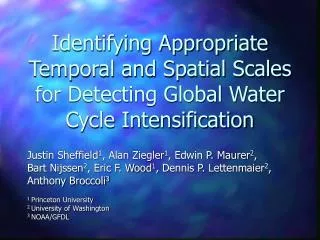
Identifying Appropriate Temporal and Spatial Scales for Detecting Global Water Cycle Intensification. Justin Sheffield 1 , Alan Ziegler 1 , Edwin P. Maurer 2 , Bart Nijssen 2 , Eric F. Wood 1 , Dennis P. Lettenmaier 2 , Anthony Broccoli 3 1 Princeton University 2 University of Washington

E N D
Identifying Appropriate Temporal and Spatial Scales for Detecting Global Water Cycle Intensification Justin Sheffield1, Alan Ziegler1, Edwin P. Maurer2, Bart Nijssen2, Eric F. Wood1, Dennis P. Lettenmaier2, Anthony Broccoli3 1 Princeton University 2 University of Washington 3 NOAA/GFDL
Questions • Is the global water cycle intensifying? • How to detect intensification? • Trends in water fluxes: P, E, Q, ds/dt • What is the required time to detect a significant trend? • Where and to what extent should monitoring be done?
Methodology • Determine Continental-scale variability in P, E, Q (VIC & GCM simulations) • Estimate minimum time required to detect warming-induced trends predicted from GCM run • Identify continental indicator “basins” that may be used for monitoring
Datasets: variance VIC PCM • Variable Infiltration Capacity LSM • 14-year (1980-1993) • Water balance variables • Global: six continents • 2 grid cells • DOE Parallel Climate Model • 100-year (2000-2099) • P & E, Q = P - E • Control (no warming) • Interpolated to VIC 2 domain (terrestrial) (Nijssen et al., J. Climate 2001)
A2 A2 Dataset: trends • PCM run B6.20 • 2000-2099 - IPCC A2 scenario: “worst plausible case” (IPCC, 2001)
Predicted Trends • Period: 2000-2099 • Mann-Kendall trend Global Trends • P: 0.6 mm y-1 • E: 0.4 mm y-1 • Q*: 0.2 mm y-1 Tmin P E Q=P-E
Trends and Variability Mm units: mm y-1
Trend Detection Minimum number of years (nmin) required to detect a trend Time series variance (VIC & GCM) b= probability for Type II error b= probability of NOT detecting intensification when it is actually occurring Trend magnitude (GCM) a= probability for Type I error a = probability of detecting intensification when there is none
Results: Minimum years for detection VIC only Low Risk/High Detectability: a = 0.05; b = 0.10
Levels of Risk P only, PCM-VIC units: years
Indicator Basins • Objective • Locate indicator basins which mimic the statistical nature of continental hydrology • Approach • VIC 14-year global dataset (2 grid cells) • Search for cells using a Genetic algorithm • Based on GAlib, http://lancet.mit.edu/ga
Genetic Algorithm • “Closeness” of a solution defined by an Objective Function: all continent cells 5% of the cells • Solutions are analogous to binary strands of genetic material • New generations are created by “mating” the better solutions and through random “mutations”
(27,30) (21,21) (19,30) (50,50) (52,50) (54,52) (All cells, N cells), P only Results: Indicator basins 10,000 generations, 173 cells = 5% of total (3459) Validated versus 1 million random solutions
Conclusions • Preliminary results indicate decades may be required to detect trends in P, E, Q • Detectability depends on risk acceptance • Diverse spatial extent needed to mimic continental hydrological variability • what is the implication for GEWEX?
Acknowledgment Thanks Justin Sheffield, Alan Ziegler, Eric F. Wood EEWR, Princeton University Edwin P. Maurer, Bart Nijssen, Dennis P. Lettenmaier CEE, University of Washington NASA grants: NAG5-9414, NAG5-9886
Results: Minimum years for detection PCM only Low Risk/High Detectability: a = 0.05; b = 0.10