Download
1 / 34
340 likes | 643 Views
Nothing Fishy About Evolution: Explore biochemical evidence for evolution. Module based on a kit from Bio-Rad Laboratories, Inc. Adapted from a presentation by Stan Hitomi Monte Vista High School, Danville, CA. Kirk Brown Tracy High School, Tracy, CA. Outline. Overview

E N D
Nothing Fishy About Evolution:Explore biochemical evidence for evolution Module based on a kit from Bio-Rad Laboratories, Inc. Adapted from a presentation by Stan Hitomi Monte Vista High School, Danville, CA. Kirk Brown Tracy High School, Tracy, CA.
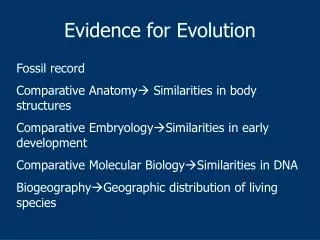
Outline • Overview • From DNA to Protein • Taxonomy and Phylogenetic Trees • Electrophoresis / SDS-PAGE • Analysis of Fish Proteins • Extension Activity
Question addressed in this module: Can we tell how closely related species are by analyzing their molecules?
Hands-on Evolution Lab • Get four different fish! (grocery store, canal, pond, ocean; fresh or frozen is OK) • Isolate total protein from fish muscle • Use polyacrylamide electrophoresis to separate proteins by size • Analyze protein profiles from a variety of fish • Compare biochemical and phylogenetic relationships
Transcription Translation Making Proteins DNA: TAC CGA TCG TGA ACT • mRNA: AUG GCU AGC ACU UGA • Protein: Met-Ala-Ser-Thr-Stop
Transcription Translation Effect of Mutation on Protein • C DNA: TAC CGA TCG TGA ACT • mRNA: AUG GCU AGC ACU UGA • G • Protein: Met-Ala-Ser-Thr-Stop • Gly
Structural Effects of Mutation on Proteins • Range of possible effects • Change one amino acid • Change many amino acids • Shorten a protein • Lengthen a protein • Remove a protein • Add a protein
Functional Effects of Mutation on Proteins • Range of possible effects • Abolish function • Slightly alter function • Generate new function • No effect on function
Classification Kingdom Phylum Class Order Family Genus Species Traditional classification based upon traits: morphological behavioral Traditional Systematics and Taxonomy
- + Electrophoresis • Mixture of molecules (e.g., DNA or protein) migrates through a gel matrix • Separation of molecules can be based on: • Size • Shape • Charge • Gel made of agarose or polyacrylamide
Smaller pore size than agarose Proteins much smaller than DNA average protein = 30-50 kD “average” DNA = >2000 kD Why Use Polyacrylamide Gels to Separate Proteins?
Polyacrylamide gels are run vertically Gels must solidify in the absence of oxygen Therefore, gels poured between glass plates Forces use of comb which makes vertical wells Vertical Electrophoresis
SDSdetergent solubilizes proteins negativecharge added to proteins CH3 CH2 CH2 CH2 CH2 CH2 CH2 CH2 CH2 CH2 CH2 CH2 O O O S - O SDS-Polyacrylamide Gel Electrophoresis (SDS-PAGE) SDS
s-s SDS, heat proteins with SDS - + Why heat the samples? • Heating the samples helps denature proteins and protein complexes, allowing the separation of individual proteins by size
Proteins (negatively charged due to SDS) move to positive electrode Proteins separate by size Smaller proteins move faster - largest large small smallest + How does SDS-PAGE work?
Protein Size • Size measured in kilodaltons (kDa) • Dalton = mass of hydrogen atom = 1 atomic mass unit • Average amino acid = 110 daltons
Selected Muscle Proteins ProteinkDaFunction titin 3000 center myosin in sarcomere dystrophin 400 anchoring to plasma membrane filamin 270 cross-link filaments into gel myosin heavy chain 210slide filaments spectrin 265 attach filaments to plasma membrane nebulin 107 regulate actin assembly a-actinin 100 bundle filaments gelosin 90 fragment filaments fimbrin 68 bundle filaments actin42form filaments tropomyosin 35 strengthen filaments myosin light chain 27slide filaments troponin (T, I, C) 30, 19, 17 mediate regulation of contraction thymosin 5 sequester actin monomers
Gel Analysis Lane 1. Kaleidoscope Markers 2. Shark 3. Salmon 4. Trout 5. Catfish 6. Sturgeon 7. Actin and Myosin Standard
Shark Salmon Trout Catfish Sturgeon Gel Analysis Compare similarities and differences of different lanes to see if correlates well with the fish evolutionary tree
kDa mm 203 8.5 135 12.0 86 18.5 41 28.0 33 34.0 19 41.5 8 44.5 Molecular Weight of Kaleidoscope Standards • Size of proteins in Kaleidoscope standard is known • Plot Distance Migrated (mm) vs. Size (kDa) on semi-log graph paper
Molecular Weight of Unknowns • Measure distance migrated for selected unknown proteins on gel • Determine size of unknowns from the graph
Biotechnology Explorer Program Serious About Science Education