Download

1 / 33
360 likes | 421 Views
Explore various Limited Dependent Variable models and sample selection corrections, including Logit and Probit models, Maximum Likelihood Estimation, hypothesis testing, and prediction accuracy evaluation. Understand the nuances of interpreting coefficients and partial effects.

E N D
Limited Dependent Variable Models and Sample Selection Corrections
Limited Dependent Variable Models and Sample Selection Corrections • Limited dependent variables (LDV) • LDV are is substantively restricted • Binary vavariables whose range riables, e.g. employed/not employed • Nonnegative variables, e.g. wages, prices, interest rates • Nonnegative variables with excess zeros, e.g. labor supply • Count variables, e.g. the number of arrests in a year • Censored variables, e.g. unemployment durations • Sample selection models • The sample used to infer population relationships is endogenously selected, e.g. wage offer regression but data only about working women
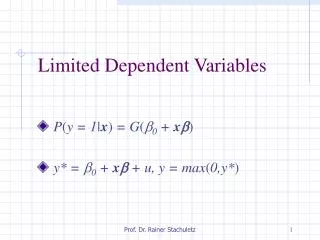
Limited Dependent Variable Models and Sample Selection Corrections Probability of a “success” given explanatory variables A cumulative distribution function . The response probability is thus a function of the explanatory variables x. Shorthand vector notation: the vector of explanatory variables x also contains the constant of the model. • Logit and Probit models for binary response • Disadvantages of the LPM for binary dependent variables • Predictions sometimes lie outside the unit interval • Partial effects of explanatory variables are constant • Nonlinear models for binary response • Response probability is a nonlinear function of explanat. variables
Limited Dependent Variable Models and Sample Selection Corrections Probit: (normal distribution) Logit: (logistic function) If the latent variable y* is larger than zero, y takes on the value 1, if it is less or equal zero, y takes on 0 (y* can thus be interpreted as the propensity to have y = 1) and Choices for the link function Latent variable formulation of the Logit and Probit models
Limited Dependent Variable Models and Sample Selection Corrections Continuous explanatory variables: where How does the probability for y = 1 change if explanatory variable xj changes by one unit? Discrete explanatory variables: For example, explanatory variable xk increases by one unit. Interpretation of coefficients in Logit and Probit models Partial effects are nonlinear and depend on the level of
Limited Dependent Variable Models and Sample Selection Corrections The probability that individual i‘s outcome is yi given that his/her characteristics are xi Under random sampling = Maximum likelihood estimates • Maximum likelihood estimation of Logit and Probit models • Properties of maximum likelihood estimators • Maximum likelihood estimators are consistent, asymptotically normal, and asymptotically efficient if the distributional assumptions hold
Limited Dependent Variable Models and Sample Selection Corrections Chi-square distribution with q degrees of freedom The null hypothesis that the q hypotheses hold is rejected if the growth in maximized likelihood is too large when going from the restricted to the unrestricted model • Hypothesis testing after maximum likelihood estimation • The usual t-tests and confidence intervals can be used • There are three alternatives to test multiple hypotheses • Lagrange multiplier or score test (not discussed here) • Wald test (requires only estimation of unrestricted model) • Likelihood ratio test (restricted and unrestricted models needed)
Limited Dependent Variable Models and Sample Selection Corrections Individual i‘s outcome is predicted as one if the probability for this event is larger than .5, then percentage of correctly predicted y = 1 and y = 0 is counted Compare maximized log-likelihood of the model with that of a model that only contains a constant (and no explanatory variables) Look at correlation (or squared correlation) between predictions or predicted prob. and true values • Goodness-of-fit measures for Logit and Probit models • Percent correctly predicted • Pseudo R-squared • Correlation based measures
Limited Dependent Variable Models and Sample Selection Corrections The partial effect of explanatory variable xj is considered for an “average” individual (this is problematic in the case of explana-tory variables such as gender) The partial effect of explanatory variable xj is computed for each individual in the sample and then averaged across all sample members (makes more sense) • Reporting partial effects of explanatory variables • The difficulty is that partial effects are not constant but depend on • Partial effects at the average: • Average partial effects: • Analogous formulas hold for discrete explanatory variables
Limited Dependent Variable Models and Sample Selection Corrections The coefficients are not comparable across models Often, Logit estimated coefficients ¼ is 1.6 times Probit estimated because . The biggest difference between the LPM and Logit/Probit is that partial effects are nonconstant in Logit/Probit: (Larger decrease in probability for the first child) Example: Married women’s labor force participation
Limited Dependent Variable Models and Sample Selection Corrections Conditional on the values of the explanatory variables, the error term is homoskedastic normally distributed The final outcome of the dependent variable is positive or zero • The Tobit model for corner solution responses • In many economic contexts, decision problems are such that either a positive amount or a zero amount is chosen (e.g. demand for alcohol) • A linear regression model may be inadequate in such cases as predictions may be negative and effects of explanatory variables are linear • The Tobit model also makes use of a latent variable formulation • Definition of the Tobit model
Limited Dependent Variable Models and Sample Selection Corrections For positive outcomes, the normal density (applied to ) is used, for zero outcomes the probability is one minus the probability that the latent variable is greater than zero (see Probit). Maximization of the log-likelihood: As in the Logit/Probit case, the maximization problem is highly nonlinear. It cannot be solved analy-tically and has to be solved with the help of computer software using e.g. Newton-Raphson methods. Maximum likelihood estimation of the Tobit model
Limited Dependent Variable Models and Sample Selection Corrections Conditional mean for all outcomes: The mean for all outcomes is a scaled version of the mean for only the positve outcomes (this is the reason why a regression using only the positive outcomes would yield wrong results) Conditional mean for positive outcomes: The mean for only the positive outcomes is the usual linear regression but plus an extra term (this is again a reason why an ordinary linear regression would yield wrong results) This is the socalled inverse Mills ratio Interpretation of the coefficients in the Tobit model
Limited Dependent Variable Models and Sample Selection Corrections On the probability for a nonzero outcome: Note that all partial effects depend on the explanatory variables and the error variance This adjustment factor can be shown to lie between zero and one On the mean for positive outcomes: On the mean of all possible outcomes including zero: Note that this adjustment factor also lies between zero and one Partial effects of interest in the Tobit model
Limited Dependent Variable Models and Sample Selection Corrections On the probability for a nonzero outcome: Analogous formulas are available for partial effects at the average (PEA) but they have the afore mentioned disadvantages On the mean for positive outcomes: On the mean of all possible outcomes including zero: Estimation of average partial effects in the Tobit model
Limited Dependent Variable Models and Sample Selection Corrections Because of the different scaling factors involved, Tobit coefficients are not comparable to OLS coefficients. To compare Tobit and OLS, one has to compare average partial effects (or partial effects at the average). It turns out that partial effects of Tobit and OLS are different in a number of cases. Another difference between Tobit and OLS is that, due to the linearity of the model, OLS assumes constant partial effects, whereas partial effects are nonconstant in Tobit. In the given example, OLS yields negative annual hours for 39 out of 753 women. This is not much but it may be a reason to view the linear model as misspecified. Example: Annual hours worked of married women
Limited Dependent Variable Models and Sample Selection Corrections • Specification issues in Tobit/Logit/Probit models • A restriction of the Tobit model is that explanat. var. influence positive outcomes and the probability of positive outcomes in the same way • This may be unrealistic in many cases, for example, when modeling the relationship between the amount of life insurance and a person‘s age • For such cases, more advanced so-called hurdle models can be used • As in Logit/Probit models, heteroskedasticity may be an issue in Tobit
Limited Dependent Variable Models and Sample Selection Corrections • ML estimates may be wrong if distributional assumptions do not hold • There are methods to deal with endogeneity in Logit/Probit/Tobit • Logit/Probit/Tobit models are also available for panel/time series data
Limited Dependent Variable Models and Sample Selection Corrections Probability that y takes on the integer value h Probability function of the Poisson distribution, where Model the mean of the dependent variable as a function of explanatory variables: The Poisson regression model models a count variable as a function of explanatory variables: The Poisson regression model for count data
Limited Dependent Variable Models and Sample Selection Corrections By what percentage does the mean outcome change if xj is increased by one? • Interpretation of the coefficients of the Poisson regression • Maximum likelihood estimation of the Poisson regression model • A limitation of the model is that it assumes • But ML estimators in the Poisson regression model are consistent and asymptotically normal even if the Poisson distribution does not hold
Limited Dependent Variable Models and Sample Selection Corrections The expected number of arrests was 2.4 percentage points lower if the average sentence length was 1 month higher. If the assumption of a Poisson distribution does not hold, ML is still consistent and asymptotically normal. This is called Quasi-Maximum Likelihood estimation (QML). If the distributional assumptions do not hold and QML is used, standard errors are wrong. One then has to compute robust standard errors (this has not been done here). Because there is evidence for overdispersion: This is evidence that the Poisson distribution does not hold and robust standard errors have to be computed. Alternatively one can inflate standard errors by the factor. Poisson regression for number of arrests
Limited Dependent Variable Models and Sample Selection Corrections True outcome (unobserved) If the true outcome exceeds the censoring threshold, only the threshold is reported Observed outcome • The censored regression model • In many cases, the dependent variable is censored in the sense that values are only reported up to a certain level (e.g. top coded wealth) • Censored normal regression model: • Regressing yi on xi would yield correct results but yi is unobserved • Regressing wi on xi will yield incorrect results (even if only the un-censored observations are used in this regression)
Limited Dependent Variable Models and Sample Selection Corrections If the censoring threshold does not bind, the density of the outcome is normal Probability/density function of observed outcome conditional on explanatory variables: Maximization of log-likelihood: Maximum likelihood estimation of the censored regression model
Limited Dependent Variable Models and Sample Selection Corrections The variable durat measures the time in months until a prison inmate is arrested after being released from prison. Of 1,445 inmates, 893 had not been arrested during the time they were followed. Their time out of prison is censored (because its end, if there was one, was not observed). For example, if the time in prison was one month longer, this reduced the expected duration until the next arrest by about 1.9%. In the censored regression model, the coefficients can be di-rectly interpreted. This is contrary to the Tobit model, where coefficients cannot be directly interpreted. The censored re-gression model and the Tobit model have a similar structure, but in the Tobit model, the outcome is of a nonlinear nature whereas in the censored regression model, the outcome is linear but incompletely observed. Censored regression estimation of criminal recidivism
Limited Dependent Variable Models and Sample Selection Corrections only observed if • Truncated regression models • In a truncated regression model the outcome and the explanatory variables are only observed if the outcome is less or equal some value ci • In this case, the sample is not a random sample from the population (because some units will never be a part of the sample) • Truncated normal regression model: • Applying OLS would not yield correct results because MLR.2 is violated
Limited Dependent Variable Models and Sample Selection Corrections One is interested in the relationship between income and education in the whole population but sampling was done so that only individuals with in-come below $50,000 were sampled. Direct application of OLS would lead to an underestimation of the slope coefficient because high incomes are omitted. Example: A regression based on a truncated sample
Limited Dependent Variable Models and Sample Selection Corrections Density of an observed outcome conditional on explanatory variables and the threshold ci: Density and distribution function of a normal distribution with mean and variance Likelihood maximization: Maximum likelihood estimation of the truncated regression model As in the censored regression model, nonnormality or heteroskedasticity in the truncated regression model lead to inconsistency
Limited Dependent Variable Models and Sample Selection Corrections Population model Sample selection indicator, si = 1 if obser-vation is part of the sample, si = 0 otherwise Regression based on selected sample Condition for consistency of OLS: • Sample selection corrections • The question is under which assumptions a sample with nonrandom sample selection can be used to infer relationships in the population • When is OLS on the selected sample consistent?
Limited Dependent Variable Models and Sample Selection Corrections • Three cases in which OLS on the selected sample is consistent • Selection is independent of explanatory variables and the error term • Selection is completely determined by explanatory variables • Selection depends on the explanatory variables and other factors that are uncorrelated with the error term • Similar results apply to IV/2SLS estimation • Instead of for explanatory variables, the conditions have to hold for the full list of exogenous variables that are used in the model • Sample selection and nonlinear models estimated by ML • Consistency if sample selection is only determined by explanat. var.
Limited Dependent Variable Models and Sample Selection Corrections • Incidental truncation (Heckman model) • Example: Wage offer function using sample of working women • One is interested in the wage of a woman with certain characteristics would be offered on the labor market if she decided to work • Unfortunately, one only observes the wages of women who actually work, i.e. who have accepted the wage offered to them • The sample is truncated because women who do not work (but who would be offered a wage if they asked for it) are never in the sample • Truncation of this kind is called incidental truncation because it depends on another variable (here: labor force participation)
Limited Dependent Variable Models and Sample Selection Corrections Main equation (e.g. wage equation) Selection equation (e.g. whether working) The error terms of both equations are jointly normally distributed (independent of the explanatory variables) with correlation coefficient For example, if the correlation of unobserved wage determinants and unobserved determi-nants of the work decision is positive, the wo-men observed working will have higher wa-ges than expected from their characteristics (= positive selection) Running the regression on the truncated sample suffers from omitted variable bias Definition of Heckman model Selection bias in OLS
Limited Dependent Variable Models and Sample Selection Corrections 1) Estimation of correction term: Estimate Probit for work decision using all ob-servations (working and nonworking women) Calculate inverse Mills ratio using Probit coefficients 2) Include estimated correction term in regression: If this coefficient is different from zero, there is nonignorable sample selection bias There have to be explanatory variables in the selection equation that are not in the main equation (exclusion restrictions), otherwise there is multicollinearity because the inverse Mills ratio is almost linear in z Estimation of Heckman model
Limited Dependent Variable Models and Sample Selection Corrections The standard errors of the two-step Heckman method are actually wrong and have to be corrected (not done here). One can also use a maximum likelihood procedure. There is no significant sample selection. This is the reason why OLS and Heckman estimates (“Heckit”) are so similar. Example: Wage offer equation for married women