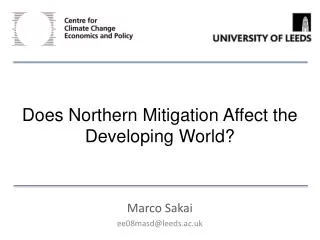
Does Northern Mitigation Affect the Developing World?
410 likes | 530 Views
This report analyzes how climate change mitigation actions by developed nations impact developing and emerging economies. The research highlights the correlation between consumption patterns in the North and environmental challenges faced in the South, as well as the role of international trade in exacerbating these issues. It reviews various mitigation strategies, including technological ventures and social policies, while advocating for a deeper understanding of the implications these strategies have on global equity and sustainable development.

Does Northern Mitigation Affect the Developing World?
E N D
Presentation Transcript
Does Northern Mitigation Affect the Developing World? Marco Sakai ee08masd@leeds.ac.uk
Overarching question “How mitigative actions undertaken by developed countries could affect development in developing and emerging economies?” Hans Opschoor (2010)
Overview • Background on climate change mitigation. • Consumption trends and consumption-based accounting. • Trade and impacts to the developing world. • Method • Results • Limitations and conclusions
Climate Change • Strong evidence that rise in global average temperatures is due to the observed increase in anthropogenic GHG concentrations. • Currently global warming is at 0.7 ° C above pre-industrial levels . • Under a “business as usual” scenario, temperatures could rise 5 to 6°C by 2100. • Source: (IPCC, 2007)
Projected Impacts of Climate Change Source: Based on Stern Review (2006)
Multilateral emissions reduction targets • Kyoto protocol: Some Annex B countries agreed to reduce emissions by 2012 relative to 1990 baseline (e.g. EU15 and other European nations -8%). • EU ETS: Cuts of at least 20% by 2020 and >80% by 2050 relative to 1990. • Cancun Agreements: Industrialized countries proposed reduction targets, including some developing countries (e.g. Brazil, China, Indonesia, Mexico, South Africa).
What is mitigation? • “Technological change and substitution that reduce resource inputs and emissions per unit of output” (IPCC, 2007) • Strong focus on technological solutions. • Low-carbon technologies • Renewable energy • Geoengineering • Energy conservation
Can technology save us? • 90% to 130% emission intensity improvement is required (Jackson, 2010) • 80% of projected 2020 emissions from the power sector are already locked in (IEA, 2011) • Window for cutting emissions (to 450 ppm - 2°) is closing fast (Stern, 2011) • Not enough just to rely on technology (HM Government, 2005)
Other mitigation actions • Social and economic policies oriented towards emission reductions and enhancement of sinks (IPCC, 2007). • Beneficial aspects of creating synergies between developed and developing nations • Clean Development Mechanism (CDM) • Reducing Emissions Reducing Emissions from Deforestation and forest Degradation (REDD).
Demand-side options • Demand-side options seek to modify directly or indirectly consumption patterns in order to achieve emission reductions. • Behavioural changes (business practices, individual lifestyles) • Instruments such as carbon taxes, border adjustments, subsidies, carbon labelling, awareness campaigns, etc. can have an effect on demand. • EU, US (Waxman-Markey bill) and Australia to implement BCA to address the issues of leakage and loss of competitiveness.
Consumption • Climate change is the greatest symptom of excessive consumption levels. • Consumption in developed countries is the main driver for increasing emissions (Sanwal, 2009) • Consumption patterns also need to be modified (Agenda 21, 1992; Rio +20, 2012) • Northern consumption causes environmental impacts in the South.
Carbon accounting • Production-based (territorial) approach: “Greenhouse gas emissions that take place within the national territory and offshore areas over which a country has jurisdiction” (IPCC, 2006). • Consumption-based emission inventories consider total emissions occurring from economic consumption within a country (Peters and Hertwich, 2008).
Consumer emissions as a percentage of territorial emissions, 2004 Source: Carbon Trust Analysis, CICERO/SEI/CMU GTAP 7 MRIO model (2004)
Income-Emissions Relationship • Panel data regressions using fixed and random effects, between-groups and differences including 113 countries. • From a consumption-based perspective, evidence rejects the EKC inverted-U hypothesis. • CO2 emissions increase monotonically with income*. higher income → higher consumption → higher emissions Sakai and Hubacek(forthcoming)
Impacts on the developing world • Changes in consumption patterns (as mitigation actions) have been largely analysed from a developed-country perspective. • The consequences of these actions in the developing world have not been sufficiently explored. • ECLAC has recently expressed concerns in Latin America, especially to policies like border adjustments and carbon labelling.
International Trade • Trade has grown three times faster than world GDP since 1990: increasing globalisation of markets. • The geographical fragmentation of production has created a new trade reality. • Rise of global production chains and the profound interdependency imply that exogenous changes in one country may induce effects in several other economies.
Fragmentation of production Source: WTO (2011) and Meng and Miroudot (2011)
The Method • Increasing use of environmentally- extended MRIO Analysis to understand environmental effects caused by consumption. • Shows the underlying structure of several economies. • Capture the interdependencies between different industries located in diverse regions. • 113 countries and 57 sectors – GTAP7
The MRIO Model Total Outputs FD (6441*113) Technology matrix (6441*6441) Value Added Total Inputs CO2 emissions Import matrices
Limitations • Static model. Data for only one year. • Price effects, production functions, elesticities, etc. not included. (started working on CGE modelling). • Developing countries are very heterogeneous. • Additional factors not captured by the model (climate variables, extreme climate events, etc.).
Conclusions • Need to lower consumption and change patterns, especially in wealthy countries, but this may cause alterations in the structure of global trade. • Poor countries are vulnerable to changes in structure of trade. • Negative consequences on welfare in the developing world aggravating adaptation costs. • Need for financial and technological transfers and strengthening absorptive capacities. • Policies should be regarded from an inclusive viewpoint that considers the needs of both developed and developing nations.
30% domestic and 15% import improvements in energy emission intensity Source: Own projections based on data by SEI