Comparative Development
Comparative Development. Lecture 2: Differences and Commonalities among Developing Countries. Comparative Development. Overview: Defining the Developing World Structural Diversity of Developing Economies Common Characteristics of Developing Nations

Comparative Development
E N D
Presentation Transcript
Comparative Development Lecture 2: Differences and Commonalities among Developing Countries
Comparative Development • Overview: • Defining the Developing World • Structural Diversity of Developing Economies • Common Characteristics of Developing Nations • Developing Countries today versus Developed Countries in their Early Stages • Are Living Standards Converging?
Defining the Developing World • Per Capita Income World Bank: Gross National Income (GNI) per capita, 208 economies • Low Income Countries (LICs) • Lower Middle Income Countries (LMCs) • Upper Middle Income Countries (UMCs) • High Income OECD countries • Other High Income Countries (Other HICs) OECD – Organization of Economic Cooperation and Development
Defining the Developing World (cont’d) • Developing Countries: LICs, LMCs and UMCs Some HICs: by UN, considered developing, due to their high levels of inequality (significant parts uneducated or in poor health) or limited industry, e.g. Kuwait, Qatar and UAE • Developing World: sub-Saharan Africa, North Africa and the Middle East, Asia (excluding Japan), Latin America and the Caribbean, the transition countries of Eastern Europe and Central Asia, including the former Soviet Union.
Defining the Developing World (cont’d) • Developed World: the countries of Western Europe, North America, Japan, Australia and New Zealand • Newly Industrialized Countries (NICs): another category often used to classify those countries with relatively advanced manufacturing sectors.
Defining the Developing World (cont’d) (2) International Indebtedness WB: • Severely indebted • Moderately indebted • Less indebted
Defining the Developing World (cont’d) WB and IMF: HIPIC: Heavily Indebted Poor Countries 39 countries: poor and heavily indebted, 33 from Sub-Saharan Africa E.g.: Afghanistan, Ethiopia, Rwanda, Niger Debt relief: HIPC's threshold requirements. 1996: the primary requirement, the country's debt remains at unsustainable levels: the ratio of debt-to-exports > 200-250% ,or the ratio of debt-to-government revenues > 280%
Defining the Developing World (cont’d) • Per capita income and indebtedness Asian Development Bank (ADB): 1999: per capita GNP and debt repayment capacity 36 borrowing DMCs into 4 groups (A, B1, B2 and C), for (i) degree of eligibility to borrow from ADF or OCR; (ii) ceiling for ADB financing, and (iii) minimum share of gov’t contribution to TA cost
Defining the Developing World (cont’d) (4)UN’s Human Development Index • Measures of health and education are included in the calculation along with income. • Geographical location ADB: East Asia (e.g., China, PRC); Southeast Asia (e.g. Indonesia); South Asia (e.g. India); Central Asia (e.g. Azerbaijan); and Pacific DMCs (e.g. Kiribati)
Defining the Developing World (cont’d)) • Note: the wide income range among the countries of the developing world. • Developing nations: shared common goals: • Reduction of poverty, inequality and unemployment • Provision of minimum levels of education, health care, housing and food • Broadening of social and economic opportunities • Forging a cohesive nation-state
Defining the Developing World (cont’d)) • Common goals correspond to common problems: • Widespread and chronic absolute poverty • High levels of unemployment and underemployment • Growing inequality • Low levels of agricultural productivity • Urban and rural imbalance
Defining the Developing World (cont’d)) • Common goals correspond to common problems: • Antiquated and inappropriate health and educational systems • Environmental decay • Severe balance of payments and international debt crises • Increasing significant dependence on foreign technologies, institutions and value systems
Structural Diversity of DCs Eight critical components: • Size (geographic area, population, and income) 2. Historical and colonial background • Endowments of physical and human resources 4. Ethnic and religious composition
Structural Diversity of DCs Eight critical components (cont’d): • Relative importance of its public and private sectors and civil society • Nature of industrial structure • Degree of dependence on external economic and political forces 8. Distribution of power, social and political structures, and economic ‘rules of the game’
Structural Diversity of DCs • Size and Income Level: physical , population and level of national income per capita important determinants of economic potential and major differentiating factor. • Advantages of size: • Diverse Resource Endowment • Large Potential Markets • More local sources for materials and products
Structural Diversity of DCs • Size and Income Level (cont’d): • Disadvantages of size: • Difficulties in administrative control • National cohesion • Regional imbalances • No relationship between size, per capita income level, and the degree of inequality. E.g. India: 2002 population of > 1million, $470/capita Singapore: 4 million, close to $21,000.
Five Most Populated Countries and Their PPP Per Capita GDP, 2003
Five Least Populated Countries and Their PPP Per Capita GDP, 2003
Historical Background • Most African and Asian nations: colonies • Economic structures, educational and social institutions are often modeled on their former colonial rulers. • Colonial rulers introduced private property, personal taxation and the requirement that taxes be paid in money rather than kind, shattering pre-existing social orders and exposing local communities to potential exploitation.
Historical Background (cont’d): • Varying degree of local involvement in colonial governance: compare India and Africa • Latin America: Spanish and Portuguese • Asia: different colonial heritages and diverse cultural traditions different institutional and social patterns (India: British; the Philippines: Spanish and American; Vietnam: French; Indonesia: Dutch; Korea: Japanese).
Physical and Human Resources • Physical Resources : land, minerals and other raw materials. • Large physical endowments , not a guarantee for development, e.g. Congo, ‘curse of natural resources’ • Favorable physical: Persian Gulf oil states. • Unfavorable: Chad, Yemen, Haiti and Bangladesh (lack of raw materials and minerals, even fertile land) • Geography and climate: • Coastal economies vs. landlocked economies • Temperate Zone vs. Tropical Zone
Physical and Human Resources (cont’d) • Human Resources: • Sheer numbers of people and their level of skill. • Other key factors include: • Cultural outlooks • Attitudes toward work • Access to information • Willingness to innovate • Desire for self-improvement • Quality of Public Administration
Ethnic and Religious Composition • Noted acceleration in ethnic, tribal and religious conflicts since the end of the Cold War. • The greater the ethnic and religious diversity of a country, the greater potential for instability. See development success stories of relatively homogenous societies like Taiwan and Singapore. • Development benefits unequally shared. • Diversity need not lead to inequality and turmoil, e.g. Malaysia and Mauritius
Mixture of the Economy and Civil Society • Most DCs have mixed economic systems – both public and private ownership and use of resources. • The mix varies, a function of historical and political circumstances • Private sector: LA and SEA nations >SA and Africa • Degree of foreign ownership in the private sector is an important factor • A recent shift of emphasis from public sector activities and state-run enterprises to privatization in many LDCs.
5. Mixture and Civil Societies (cont’d) • The appropriate development policies, depend on the mix of private and public sector ownership and activities • The degree of corruption also varies • The role of non-governmental organizations (NGOs) is also important to the development process: • Social Problem-Solving • Targeted Public Goods Provision • Trust and Credibility • Expanding Social Inclusion
Industrial Structure • The majority of developing countries are agrarian in their social, economic and cultural outlook. • The relative importance of the agricultural, manufacturing and service sectors varies widely across LDCs. • Industrial Sectors • Primary: agriculture, forestry and fishing • Secondary: Manufacturing • Tertiary: Commerce, Finance, transport and services.
Industrial Structure in 2005 Source: The World Factbook
7. External Dependence • Dependence on foreign economic, social and political forces is related to size, resource endowment and political history and is substantial for most developing countries. • Dependence on: • Foreign investment and trade • Importation of foreign capital-intensive technologies of production • International transmission of systems of education and governance.
8. Political Structure, Power and Interest Groups • The distribution of power: military, industrialists, land owners, high-level civil servants, money lenders varies across countries • Social and economic change requires either (i) the support of the ruling elite or (ii) the power of the elites be offset by more powerful democratic forces. • The success of economic and social development: the ability of social, political legal and economic institutions to change.
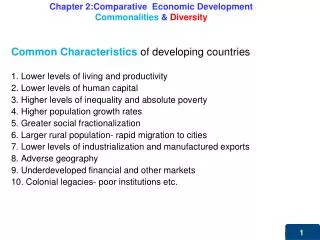
Common Characteristics • Low Levels of Living • Low Levels of Productivity • High Rates of Population Growth and Dependency Burdens • Dependence on Agricultural Production and Primary-Product Exports • Imperfect Markets and Incomplete Information • Dependence and Vulnerability in International Relations
Low Levels of Living • Low Incomes: Gross Domestic Product (GDP) per capita or Gross National Income (GNI) per capita • GDP – the total value for final use of output produced by an economy, by both residents and nonresidents. • GNI – GDP + (income residents receive from abroad for factor services– payments made to nonresidents) who contribute to the domestic economy)
Low Levels of Living (cont’d) • In 2002: over 80% of the world’s income was produced by 15% of the world’s population. • In 2002: Switzerland, 362 times the per capita income of the world’s poorest countries, Ethiopia, and 77 times of one of the world’s largest nations, India
Low Levels of Living (cont’d) • When comparing GNI and GDP across countries using exchange rates, one must be careful. • Conversion through exchange rates often does not reflect differences in domestic purchasing power of different currencies. • Purchasing Power Parity (PPP)– uses a common set of international prices for all good and services produced, valuing goods in all countries at US prices.
Low Levels of Living (cont’d) • PPP: the number of units of a foreign country’s currency required to purchase the identical quantity of goods and services in the local (LDC) market as $1 would buy in the United States.
Low Levels of Living (cont’d) E.G. Big Mac Hamburger: • in US: US$2.5; in Indonesia: Rp. 35,000. • Implied PPP of the US Dollar according to the Hamburger standard = 35,000/2.5 = 14,000. • 14,000 is the exchange rate of the dollar should be for the price of a Big Mac to be the same in terms of dollars in both countries.
Low Levels of Living (cont’d) E.G. Big Mac Hamburger: • Say, actual foreign exchange rate, 1 USD= Rp. 10,000. • (PPP-Actual)/(Actual) *100% = [(14,000-10,000)/(10,000)]*100%= 40%, or an undervaluation of the dollar vis-à-vis Rupiah by the hamburger standard • Since the dollar price of Big Mac is higher in Indonesia (USD3.5) than in US (USD2.5), the Rupiah is over valued
Low Levels of Living (cont’d) • Inequality – greater disparities between the income of the rich and poor in developed countries. • Slow growth rates of national income and real income per capita • Large portions of the population suffering from absolute poverty (living on less than PPP US $370).
Low Levels of Living (cont’d) • Low levels of literacy, significant school drop out rates, inadequate and irrelevant education. • Ill health, high infant mortality, malnutrition, debilitating diseases • All these characteristics interact to reinforce and perpetuate each other.
Extent of Poverty • Absolute Poverty: living below the minimum level of income needed to satisfy basic necessities • International Poverty Line: a constant US $1 per day, estimate PPP equivalent in terms of a developing country’s own currency • An increase in the number of people living below the poverty line, a decrease in the proportion of the people living below this threshold in some areas • A“poverty shift” in population towards the transition economies of Eastern Europe and Central Asia, and sub-Saharan Africa.
Purchasing Power Parity • PPP: the number of units of a foreign country’s currency required to purchase the identical quantity of good and services in the local market as would US$1 buy in the United States. • If domestic prices in LDCs are low, then measures of GNI per capita will be lower than those using PPP and will exaggerate differences. • Example: China’s GDP in 2002, was US$960 according to exchange rate conversion but using PPP it was US$4,520.
Human Development Index • UNDP’s measure of socioeconomic development: rank all countries on a scale of 0 (low) to 1 (high) of human development based on three indicators of development. • Knowledge: measured by a weighted average of adult literacy (2/3) and mean years of schooling (1/3) • Longevity: measured by life expectancy at birth • Standard of Living: measured by real per capita income adjusted for differences in purchasing power parity. • These three measures are combined into a formula to calculate the score.
HDI (cont’d) • Country Categories: • Low Human Development: 0.0 to 0.499 • Medium Human Development: 0.50 to 0.799 • High Human Development: 0.80 to 1.0
Calculating HDI • Income Index (I.I.) I.I. = [log(Y) – log(100)] [ log (40,000) –log(100)] where Y is the country’s PPP income per capita $100 is considered the “lower goalpost” for income. $40,000 is considered the “higher goalpost” for income
Calculating HDI • Life Expectancy Index (L.E.I.) L.E.I. = X - 25 85 - 25 where X is the country’s life expectancy at birth. 25 is considered the “lower goalpost” for LE 85 is considered the “higher goalpost” for LE
Calculating HDI • Education Index (E.I.): E.I. = (2/3)(A.E.I.) + (1/3)(G.E.I.) where • Adult Literacy Index (A.L.I.) = (AL-0)/(100-0) • Gross Enrollment Index (G.E.I.)= (GEI-0)/(100-0) HDI=(1/3)(I.I.) + (1/3)(L.E.I.) + (1/3)(E.I.)