Download
1 / 48
480 likes | 571 Views
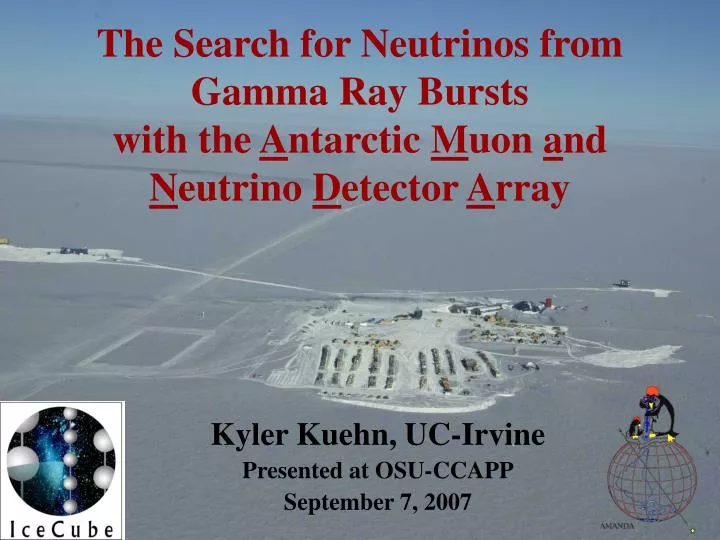
The Search for Neutrinos from Gamma Ray Bursts with the A ntarctic M uon a nd N eutrino D etector A rray. Kyler Kuehn, UC-Irvine Presented at OSU-CCAPP September 7, 2007. Outline. Results - Effective Collection Area: A eff - Combined Observations: 1997-2003

E N D
The Search for Neutrinos from Gamma Ray Bursts with the Antarctic Muon and Neutrino Detector Array Kyler Kuehn, UC-Irvine Presented at OSU-CCAPP September 7, 2007
Outline • Results • - Effective Collection Area: Aeff • - Combined Observations: • 1997-2003 • - Flux and Fluence Limits • - Model Rejection Factors • Future of Transient Point Source Searches • - Failed GRBs • - Jet-Driven SNe • Conclusions • Introduction - The Punch Line - Gamma-Ray Bursts - Models of Emission - AMANDA - Principles of Detection • Analysis Procedure - Correlated Observations - Burst Types - Detector Stability - Data Selection Criteria - Systematic Uncertainties
Alabama University, USA • Bartol Research Institute, Delaware, USA • Pennsylvania State University, USA • UC Berkeley, USA • UC Irvine, USA • Clark-Atlanta University, USA • University of Alaska, Anchorage, USA • Univ. of Maryland, USA • IAS, Princeton, USA • University of Wisconsin-Madison, USA • University of Wisconsin-River Falls, USA • LBNL, Berkeley, USA • University of Kansas, USA • Southern University and A&M College, Baton Rouge, USA The IceCube Collaboration Japan USA (14) Europe (15) • Chiba University, Japan • University of Canterbury, Christchurch, NZ New Zealand • Universite Libre de Bruxelles, Belgium • Vrije Universiteit Brussel, Belgium • Université de Mons-Hainaut, Belgium • Universiteit Gent, Belgium • Humboldt Universität, Germany • Universität Mainz, Germany • DESY Zeuthen, Germany • Universität Dortmund, Germany • Universität Wuppertal, Germany • MPI Heidelberg, Germany • Uppsala University, Sweden • Stockholm University, Sweden • Imperial College, London, UK • Oxford University, UK • Utrecht University, Netherlands ANTARCTICA
A New Astronomical Messenger Cutoff determined by μG galactic B field Cutoff determined by e+e- threshold for stellar IR photons diffuse, GRB AGN, TD Neutrinos open a new window onto astrophysical processes in ways which no other particle can
The First GRB • Observed by Vela (test-ban monitor) • Intense burst of high-energy (>keV) photons over short time period (<10 s.) • Cause unexplained for decades...
The BATSE Revolution (1991-2000) A total of 8 detectors, one on each corner of CGRO • Located on the Compton Gamma-ray Observatory (CGRO) • Detected ~1 GRB/day with 1/3 sky coverage • Led to many of the breakthroughs in our understanding of GRBs Burst and Transient Source Experiment
What Did BATSE Observe? Galactic coordinates Isotropy is an indicator of the cosmological origin of GRBs (also determined from redshift measurement of BeppoSAX)
What Did BATSE Observe? Bimodal Distribution: Two Classes of Bursts
Gamma-Ray Burst Lightcurves Widely varying characteristics between, and even within, GRB classes: duration, peak flux, time profile, etc. Short GRBs Long GRBs
Canonical Progenitor Theories • Collapsars widely accepted to be associated with long-duration bursts (t90 > 2 s.) • NS-NS mergers associated with short-duration bursts (SGR giant flares also sGRBs?) • GRB Phenomenology and (usually) emission mechanism are independent of nature of progenitor: Fireball • Other progenitor models: Cannonball mechanism? Image courtesy of David Darling
Fireball Model of GRB Emission Jet break seen when opening angle equals observer viewing angle Image courtesy of T. Piran (Science 295, 986)
Characteristics of the Fireball according to Waxman, astro-ph/0303517 • relativistically expanding jet, accelerated by (magneto-)hydrodynamic mechanisms • 102 Γ 103 from constraints of non-thermal spectrum • Internal collisions within fireball lead to γ-ray emission (synchrotron, inverse Compton) • Ejecta eventually expand into ISM (reverse shock, afterglow, jet opening angle θ >> 1/Γ0)
GRB Search: Science Motivation • Cannot directly observe the inner engine of GRBs (stellar progenitor environment optically thick) • If protons are accelerated in the GRB environment*, neutrinos will be produced: p + ±m± + nm e ± + ne + nm + nm (this could also explain the origin of UHECRs) • Probe inner engine and physics of the explosion, eventually test neutrino properties • Predicted neutrino flux varies depending upon specific model parameters (GRB emission mechanism, neutrino spectrum, ν/γ ratio, etc.) * But see also Lyutikov & Blandford, astro-ph/0312347: the “Poynting-flux dominated” model of GRB emission predicts negligible baryon loading and ~0 neutrinos.
GRB Muon Neutrino Spectra Waxman, E., Nuc. Phys. B 118 (2003) Razzaque et al., PRD 68 083001 (2003) “Precursor” Razzaque et al., PRL 90 241103 (2003) “Supranova” Max SN/GRB efficiency Murase & Nagataki (Set A) PRD 73 063002 (2006) See also Dar & DeRújula (astro-ph/0105094): “CannonBall” Model predicts that bursts with F > 10-5 erg cm-2 (~10%) emit »1 in narrow beam, (Θ/Θγ)2 ~ 1/100
AMANDA ν IceCube CGRO IPN Satellites (HETE, Swift, etc.) γ, ν GRB timing/localization information from correlations among satellites A Distant GRB
South Pole South Pole • AMANDA-II: 19 Strings, 677 Optical Modules • AMANDA B-10: 10 strings, 302 Optical Modules • Trigger rate: ~70 Hz (mostly downgoing muons) • Angular resolution: δθ ~ 3° (likelihood reconstruction)
Digital Optical Module (DOM) 8’’ Hamamatsu PMT with twisted pair (electrical) or optical fiber transmission cable with in situ calibration source (LED + diffuser or laser) Few percent failure rate—primarily cable penetrator disconnection on refreezing)
AMANDA: Principles of Detection • νμ + N μ + X • μ emits Cherenkov radiation within ~1° of direction • Particle direction reconstructed from timing correlations between OMs: Look for sources...
AMANDA: Principles of Detection • Observations over entire sky • If an upgoing particle is observed, it must be a neutrino—nothing else can travel through the entire earth • Downgoing/horizontal events used in UHE, cascade analysis (minimal background above 107 GeV)
Data Acquisition & Processing • Offline Analysis • Level Zero • Hit Cleaning • Flare Checking • Level One • FG Reconstruction • Angular Selection (70º) • Level Two • Advanced Reconstruction • Angular Selection (80º) • Level 3+ • Analysis-Specific • Selection Criteria
AMANDA’s Objectives • Transient Point Sources: GRBs • Continuous Point Sources: AGNs, SNRs • Diffuse Sources: “low” energy (<105 GeV) and ultra-high energy (e.g. GZK ) • Atmospheric • Dark Matter: indirect detection via • WIMP annihilation in Earth/Sun • Cosmic Rays: Energy Spectrum • and Composition • Glaciology/Paleoclimatology
Analysis Goals Previous work with GRBs (1997-2000) by AMANDA collaboration This work describes an independent analysis with refined search algorithm applied to extended dataset • Based on methods of prior analyses, but derived independently • Improve cut selection, reconstruction • Apply search algorithm to new burst types: Used Third InterPlanetary Network of satellites (IPN) exclusively after BATSE ceased data-taking on May 26, 2000 Analysis designed to increase probability of GRB neutrino detection or in the absence of a detection, to improve the flux upper limit on various predicted neutrino spectra.
Observation Procedure • Burst location and timing determined by: • BATSE • Burst Catalogs • Stern, Kommers • GUSBAD • IPN3 • IPN Circulars • Archival search • (K. Hurley et al.) • Instrument Energy (keV) • BATSE LAD: 50-300 • Ulysses: 25-150 • Konus: 12-10000 • BeppoSAX: • GRBM: 40-700 • WFC: 2-26 • HETE-II: • FREGATE: 6-400 • WFXM: 2-25 • SXC: 1-14 • Mars Odyssey: 100?-8000 • INTEGRAL: 15-10000 • NEAR 100-10000 • RHESSI 300-25000
Categories of Observed Bursts • BATSE Triggered • Theoretical models based on “standard” GRBs* • Localized to <1/2 searchbin size (usu. arcmin.) • BATSE Non-Triggered • Significantly lower peak flux • Not incorporated into theoretical models • IPN Well-Localized Bursts (BATSE trig?) • IPN Annular-Localized (“Banana”) bursts *some models further restricted to only long GRBs (t90 >2 s)
~10% of IPN do not trigger BATSE (135 BATSE non-trig, 1088 BATSE triggered) Why non-triggered? Earth occultation, SAA, other downtime Energy Range, Collecting Area, Efficiency: BATSE>Ulysses Not Due to Sensitivity! Include All IPN as Triggered-Equivalent Adds <10% uncertainty for all IPN bursts IPN as Triggered Bursts
Annular-Localized (“Banana”) Bursts Annulus segment length = 20° from KONUS ecliptic latitude determination ~3x standard searchbin size Requires more restrictive selection criteria to remove 3x more BG See also forthcoming results of Anna Franckowiak, who performed an analysis on 64 Annular-Localized bursts from 2000-2004.
Blinded 10 minute window + 5 minutes - 5 minutes - 60 minutes + 60 minutes ~110 (120-10) minute background used to set cuts and check for data quality & stability Observation Procedure • Background region is approximately ±60 minutes surrounding each GRB • Omit ±5 minutes surrounding GRB trigger time • Expected NBG/burst = Off-Time Rate x Burst Duration/110 minutes
Detector Stability Stability Criteria: • Number of functional OMs • Not missing important segments of data • Time between events (t) • Nevents/10 s. well modeled by Gaussian fit: (P=[RMS(data) – Sigma(fit)]/RMS) • P<6% OR 6%<P<12% and no on-time/off-source fluctuations > 3σ
Detector Stability (Continued) Representative sample of background (2 hour) time period with uncorrelated events: e-αx with α = 1.8 t = 1/rate 0.56 Hz, as expected after application of initial data “cleaning” and angular restrictions Avoid “false negatives”: anomalously large time differences between subsequent events signify missing data where no signal would be detected Occurrences in 2 hr. window time difference (t)
Detector Stability (continued) Representative sample of background (2 hour) time window with uncorrelated events Mean event rate ~7 Hz, as expected after application of initial data “cleaning” and loose angular restrictions Avoid “false positives”: anomalously large numbers of high Nevents/10 s. signify excess events which could mimic signal events Occurrences in 2 hr. window (BATSE#6610) 30 40 50 60 70 80 90 Nevents/10 s.
Simulated and Observed Data • Simulated Signal • Nusim (or muo0) Muon Monte Carlo (MMC) AMASim • 10k generated events/file * ~100 files/year <1% statistical uncertainty in any energy bin • Optimized for W-B spectrum, reweighted to other spectra • Simulated Background • CORSIKA (w/QGSJet) MMC AMASim • Used primarily as a “sanity check” for GRB analysis • Observed Data • approximately February 15 - December 10 each year • ~10 TB raw data/year (muon DAQ + TWR DAQ) • Transmitted to White Sands via satellite link + stored on magnetic tape • Simulated and Observed data processed identically • Data Reduction includes “Hit Cleaning”, Initial track/cascade econstruction, zenith angle selection • Individual analyses implement higher level selection criteria
Simulation Characteristics • DATA agree with • BG SIMULATION • but are distinct from • simulated signal events based on W-B model • Observed BG modeled well by simulated events • Provides additional measure of confidence for signal simulations (see also Ph.D. Dissertation of J. Hodges from UW)
Optimization of Selection Criteria Minimize Model Rejection Factor*, based on sensitivity for Waxman-Bahcall and Precursor neutrino spectra: MRF = Event Upper Limit, FC†[90%] . Expected Signal from simulations (Nsig) Nsig = ∫Aeff,(E) (E) dE dt dΩ Iterative Minimization of MRF with N-1 cuts applied * Hill, G., and K. Rawlins, Astropart. Phys.19 (2003) 393-402 † Feldman, G., and R. Cousins, PRD 57 (7) 3873 (this formalism is particularly useful for small number statistics) (μ90)
Data Selection Criteria (“Cuts”) Selection criteria to separate signal from background: • Event Time: (t0 - 110 s) to (t0 – 10 s) for precursor search (t0 - 10 s) to (t0 + duration + 1 s) for coincident search where duration = t90 for BATSE bursts, t3σ for IPN bursts • Angular Mismatch of Reconstructed Track Direction (i) relative to burst position; several different reconstructions applicable (i=1-4) • Uniformity (S) of hits along reconstructed track • Number of Hit Channels (NCH) • Number of Direct Hits (NDir) with small time delay from scattering • Angular Resolution (σ) of alternate track reconstruction • Zenith-weighted log(Likelihood) of Reconstructed Track log(£reco)
Representative Selection Criteria Simulated Signal Observed BG Simulated Signal Observed BG Angular Mismatch (2) Track Uniformity (S)
Selection Criteria Optimization Reasonable ranges are tested for each criterion individually, then in conjuction with all other criteria (“iterative N-1 optimization”) In this example, a slightly larger mismatch angle is chosen to provide higher signal retention, given the burst position uncertainty. Relative MRF Angular Mismatch 1
Effective Neutrino Collecting Area Nsig=f * ∫Aeff,(E)(E)dEdtdΩ calculated for A-II, B-10 bursts Aeff, includes: σcc, rμ, selection critiera, earth attenuation effects dt livetime = NBursts/700 dΩ searchbin size f = statistical correction for burst subtypes selected (long, short, triggered, etc.) Collecting Area Aeff, (cm2) log10(Neutrino Energy/GeV) = No Attenuation = B-10 GRB = A-II Point Source (50o) = A-II Diffuse
Observations 1997-2003 Feldman-Cousins 90% Confidence Level Event Upper Limit for 0 observed/1.74 expected: μ90 = 1.30 (~1/3 Expected Sensitivity) μ*90 =μ90(POLE) = 1.1 Recall Model Rejection Factor: MRF(*) = μ(*)90/ Nsig 00-03 = 151 GRBs Also Observed 0 Events in coincidence with 153 Non-Triggered BATSE Bursts from 1997-2000
MRFs and Flux Upper Limits MRF*(Waxman & Bahcall) = 1.3 This benchmark flux prediction will be reached within a few years. MRF*(Murase & Nagataki) = 0.82 Observations eliminate predictions of Parameter Set A at 90% CL. MRF*(Supranova) = 0.40 Observations eliminate most optimistic assumptions, in agreement with observations. CannonBall: 0 events, 419 bursts (Θ/Θγ)2≤ 1/40 Testing Other Models: MRF*(DePaolis) = 0.71 MRF*(Precursor) = 14.
Comparative Flux Upper Limits UHE diffuse this work This GRB analysis has the most sensitive limit to date–more than a factor of 10 better than other AMANDA analyses!
Spectrum-Independent Limits Green’s Function Fluence Limit from Super-Kamiokande: Fukuda et al., ApJ578 (2002) 317 Φ(Eν) = N(90) . Aeff(Eν) where N(90) = FC90(Nobs, NBG)/Nburstsand Nbursts = Ntrig + NIPN Limit is independent of assumed ν spectrum! Differential Fluence Limit at each energy can be integrated and converted into flux limit over all energies
Green’s Function Fluence Limit Integrating the Green’s function fluence limit over 250 GeV to 107 GeV provides results consistent with the flux upper limit for the Waxman-Bahcall model described earlier: E2 < 1.3 GeV cm-2 s-1 sr-1 (MRF ~2.5 for 151 bursts)
Extending the Transient Point-Source Search: “Failed” GRBs • GRB/SN: 980425/1998bw, 030329/2003dh (also, XRF020903—see astro-ph/0502553) • “Failed” GRB: no γ signal (perhaps afterglow) • Up to 100x observed GRB rate • Uncorrelated searches: rolling time-window, diffuse • Correlated search: Some fraction of SNe Ib/c are correlated with GRBs, so use SNe spatial/temporal information to isolate potential GRB ν signals
Extending the Transient Point-Source Search: Supernova Jets • Mildly relativistic jet (Γ~2-6) can produce TeV ν’s: • SN at 3 Mpc (0.1/yr) may produce ~300 events in IceCube • SN at 20 Mpc (several/yr) may produce “several” ν • 3%-25% of SNe may be jet-driven • astro-ph/0502521, 0407064, 0403421, 0402163, 0307228, 0303621 • CBAT catalogue (1997-2004): ~1400 SN, 119 SNIb/c • GRB-like supernovae are promising candidates!
Conclusions and Outlook • AMANDA has been searching for high-energy ν’s in spatial and temporal correlation with GRBs since 1997 • Null result from 7 years of observations places stringent limits on coincident & precursor ν emission from GRBs • We are beginning to constrain the parameter space for several theoretical models (esp. MN06, R03) • Green’s Function fluence limit allows test of any theoretical ν spectrum based on AMANDA observations • Ongoing observations: IPN/Swift/GLAST and IceCube