Download
1 / 6
70 likes | 412 Views
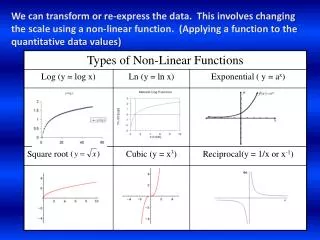
We can transform or re-express the data. This involves changing the scale using a non-linear function. (Applying a function to the quantitative data values).

E N D
We can transform or re-express the data. This involves changing the scale using a non-linear function. (Applying a function to the quantitative data values)
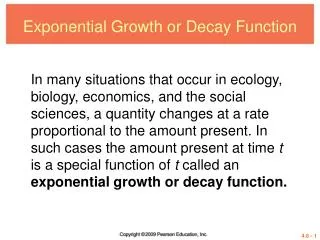
For our course, we will focus only on exponential (y =a∙bx) and power (y = a∙xp) models, but there are other models that could describe a set of bivariate data. In order, to find an appropriate model for the data, we will “transform” one or both variables using a non-linear function in attempts to make the relationship linear temporarily. Because both of the models we are using deal with exponents, we will use logarithms to transform the data. Once we find the appropriate function, we will solve the resulting transformed regression equation to find the non-linear model.
How do you know which non-linear function to use? • Most transformations will be exponential or power in nature. • Taking the log of one or both of the variables will reveal this 1) Look at the scatterplot for a pattern • Exponential • Take the log of the response variable • Create a new scatterplot and do the regression analysis (r, r2) • Does that make it MORE linear? • Power • Take the log of BOTH the explanatory and response variables • Create a new scatterplot and do the regression analysis (r, r2) • Does that make it MORE linear?
Fishing tournament activity Exponential or Power?
Now that we have achieved linearity… 2) Perform the regression analysis on the transformed data and find the LSRL, r, r2 Exponential log y = a + bx Power log y = a + b ·log x 3) Solve the logarithmic equation for y. Exponential y =a∙bx Power y = a∙xp