Download

1 / 13
130 likes | 155 Views
Learn how to compare gene sequences, identify evolutionary relationships, and use similarity searching for genetic analysis. Understand the importance of public databases like GenBank and SwissProt, the difference between similarity and homology, and how to compare sequences using alignment programs or manual methods. Explore global vs local similarity, the significance of protein vs DNA sequences, and the use of dot plots for similarity analysis.

E N D
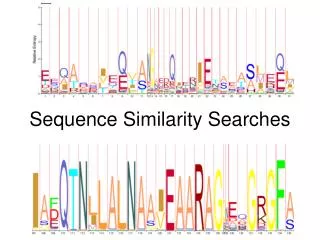
Sequence Similarity Searching 75321 Class 4 March 2010
Why Compare Sequences? Identify sequences found in lab experiments What is this thing I just found? Compare new genes to known ones Compare genes from different species information about evolution Guess functions for entire genomes full of new gene sequences
Are there other sequences like this one? 1) Huge public databases - GenBank, Swissprot, etc. 2) Sequence comparison is the most powerful and reliable method to determine evolutionary relationships between genes 3) Similarity searching is based on alignment 4) BLAST and FASTA provide rapid similarity searching a. rapid = approximate (heuristic) b. false + and - scores
Similarity ≠ Homology 1) 25% similarity ≥ 100 AAs is strong evidence for homology 2) Homology is an evolutionary statement which means “descent from a common ancestor” common 3D structure usually common function homology is all or nothing, you cannot say "50% homologous"
How to Compare Sequences? GATGCCATAGAGCTGTAGTCGTACCCT <— —> CTAGAGAGC-GTAGTCAGAGTGTCTTTGAGTTCC Manually line them up and count? an alignment program can do it for you or a just use a text editor Dot Plot shows regions of similarity as diagonals
GlobalvsLocalsimilarity 1) Global similarity uses complete aligned sequences - total % matches GCGGAP program, Needleman & Wunch algorithm 2) Local similarity looks for best internal matching region between 2 sequences GCGBESTFIT program, Smith-Waterman algorithm, BLAST and FASTA 3) dynamic programming optimal computer solution, not approximate
Search with Protein, not DNA Sequences 1) 4 DNA bases vs. 20 amino acids - less chance similarity 2) can have varying degrees of similarity between different AAs - # of mutations, chemical similarity, PAM matrix 3) protein databanks are much smaller than DNA databanks
Similarity is Based on Dot Plots 1) two sequences on vertical and horizontal axes of graph 2) put dots wherever there is a match 3) diagonal line is region of identity (local alignment) 4) apply a window filter - look at a group of bases, must meet % identity to get a dot