
Multivendor, Multisite DCE-MRI Phantom Validation Study
Multivendor, Multisite DCE-MRI Phantom Validation Study. Edward Jackson 1 , Edward Ashton 2 , Jeffrey Evelhoch 3 , Michael Buonocore 4 , Greg Karczmar 5 , Mark Rosen 6 , David Purdy 7 , Sandeep Gupta 8 , Gudrun Zahlmann 9

Multivendor, Multisite DCE-MRI Phantom Validation Study
E N D
Presentation Transcript
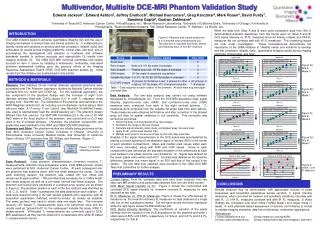
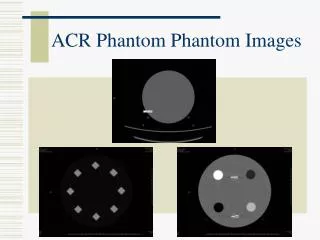
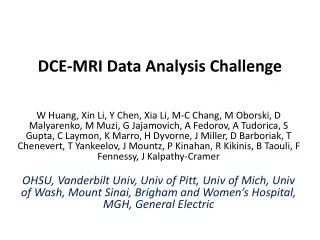
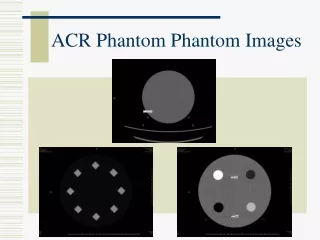
Multivendor, Multisite DCE-MRI Phantom Validation Study Edward Jackson1, Edward Ashton2, Jeffrey Evelhoch3, Michael Buonocore4, Greg Karczmar5, Mark Rosen6, David Purdy7, Sandeep Gupta8, Gudrun Zahlmann9 1University of Texas M.D. Anderson Cancer Center, 2VirtualScopics, Inc., 3Merck Research Laboratories, 4University of California Davis, 5University of Chicago, 6University of Pennsylvania, 7Siemens Medical Systems, 8GE Global Research Center, 9F. Hoffman - La Roche, Ltd. While the data from Sites A and B were quite consistent, data from Site C demonstrated dramatic departures from the trends seen for Sites A and B. DCE signal intensity vs. IR R1 measures were not linearly related, and VFA R1 measures did not correlate well with IR R1 measures. The underlying issues are now under investigation. These inconsistencies demonstrate the importance of the QIBA initiative to “identify needs and solutions to develop and test consistent, reliable, valid…quantitative imaging results across imaging platforms, clinical sites, and time”. INTRODUCTION Mean correlation coefficient: 0.979 Mean slope / intercept: 45.2 / -4.2 Mean correlation coefficient: 0.818 Mean slope / intercept: 37.9 / -5.4 Figure 3a: Site A, Week 0 Figure 2: Phantom and cuboid positioned in a 4-channel torso phased-array coil. The phantom is scanned five times, before and following each of four 90o rotations. The QIBA initiative seeks to advance quantitative imaging (QI) and the use of imaging biomarkers in clinical trials and clinical practice by: 1) collaborating to identify needs and solutions to develop and test consistent, reliable, valid, and achievable QI results across imaging platforms, clinical sites, and time, and 2) accelerating the development and adoption of hardware and software standards needed to achieve accurate and reproducible QI results from imaging methods [1]. The QIBA DCE-MRI technical committee has initially focused on item 1) above by initiating a multivendor, multicenter, test-retest phantom assessment building upon the previous efforts of the Imaging Response Assessment Teams (IRAT) DCE-MRI phantom studies [2]. Initial results from this initiative are summarized in this exhibit. Mean correlation coefficient: 0.816 Mean slope / intercept: 38.0 / -2.9 Mean correlation coefficient: 0.974 Mean slope / intercept: 44.6 / -1.5 Figure 3b: Site A, Week 1 METHODS & MATERIALS Mean correlation coefficient: 0.994 Mean slope / intercept: 38.3 / -1.9 Mean correlation coefficient: 0.985 Mean slope / intercept: 33.0 / -3.0 Phantom: Two matched 20-cm internal diameter spherical phantoms were purchased from The Phantom Laboratory (funded by National Cancer Institute contracts N01-CO-12400 and 27XS112). For this particular application, the key component of the phantom design was the inclusion of eight 3-cm diameter spheres filled with CuSO4-doped H2O to yield T1 relaxation times ranging from ~300-960 ms. The remainder of the phantom was identical to the ADNI Magphan phantom [3, 4]. including a 6-cm diameter central sphere filled with pure water. A 17-cm by 11-cm “cuboid”, also filled with 30 mMNaCl water, was used to appropriately load the radiofrequency coil. This phantom design differed from that used by the IRAT MR Committee [2] in the use of 30 mMNaCl water in the flood section of the phantom and cuboid and no D2O was used in the 8 contrast spheres. Otherwise, the phantom components and positioning were identical for the IRAT and QIBA DCE-MRI initiatives. Scanners and Sites: The phantom studies are initially being performed at five sites (M.D. Anderson Cancer Center, University of Chicago, University of Pennsylvania, Duke University Medical Center, and University of California Davis) utilizing 1.5T scanners from GE, Philips, and Siemens. (Figure 1) Figure 3c: Site B, Week 0 Table 1: Data acquired at each rotation of the phantom. All data were acquired again one week later. Data Analysis: The raw data analysis was carried out using software developed by VirtualScopics, Inc. From the DCE-MRI acquisition data, signal intensity, signal-to-noise ratio (SNR), and contrast-to-noise ratio (CNR) measures were computed from each of the eight contrast spheres. T1 measures were computed from the variable flip angle data from each sphere. These measures were obtained both before and after correction of the phased array coil data for spatial variations in coil sensitivity. This correction was carried out as follows: Import the body coil and phased array ratio images Normalize the range of the two images Calculate signal intensity ratios (body coil:phased array) for each pixel Apply 21x21 pixel kernel median filter Multiply each pixel in the source image by the ratio map pixel data Analysis of the signal characteristics in the DCE scans was accomplished by placing a uniform spherical 2-cm diameter region of interest (ROI) in the center of each phantom compartment. Mean and median pixel values within each ROI were calculated, along with SNR and CNR values. Noise in each compartment was defined as the standard deviation of the differences at each pixel between one phase and the next divided by √2. Signal was defined as the mean signal value within each ROI. Contrast was defined as the absolute difference between the mean signal in an ROI and that of the central 6-cm sphere. The raw data thus obtained were provided to the QIBA DCE-MRI Technical Committee for further analysis. Mean correlation coefficient: 0.994 Mean slope / intercept: 37.6 / -1.8 Mean correlation coefficient: 0.982 Mean slope / intercept: 33.1 / -3.2 Figure 3d: Site B, Week 1 Figure 4: VFA R1vs IR R1 Measures Figure 1: Phantom scanning process. Scan Protocol: Initial phantom characterization (inversion recovery T1 measurements, phantom cross-comparison scans, initial QIBA protocol scans) were performed at M.D. Anderson Cancer Center. At each subsequent site, the phantom was scanned twice, with one week between the scans. During each scanning session, the phantom was rotated 90o four times and rescanned at each position. This provides data necessary for a “coffee break” test–retest analysis as well as a one-week interval test-retest analysis. The phantom and cuboid were positioned in a phased-array receive coil as shown in Figure 2. The phantom position at each of the five rotations was identified as A, B, C, D, and A’. Table 1 summarizes the data obtained at each rotation. All data were acquired using a 3D fast spoiled gradient echo sequence with all acquisition parameters matched, vendor-to-vendor, as closely as possible. The same protocol was used to obtain data one week later. The inversion recovery (IR) based T1 measurements were only performed once and the results used as “ground truth” for the subsequent variable flip angle (VFA) T1 measurements. VFA-based T1 measurements are commonly used in DCE-MRI applications as they can be obtained in a reasonable time while IR-based T1 measurements cannot. PRELIMINARY RESULTS Current Status: Thus far, complete data sets have been obtained from two sites (two MR vendors) and partial data obtained from one site (third vendor). DCE Mean Signal Intensity vs. R1: Figure 3 shows the uncorrected and corrected DCE signal intensity vs. inversion recovery R1 measures for data obtained at two sites. IR R1 Measures vs. VFA R1 Measures: Figure 4 shows the VFA-derived R1 measures vs. the inversion recovery R1 measures for data obtained at a single site, but on two subsequent weeks. The left figure shows the linear regression while the right figure shows the Bland-Altman plot. DCE Signal Intensity Variations: The coefficients of variation of the signal intensity over the duration of the DCE acquisitions for the baseline and week 1 scans were 0.50% and 0.56%, respectively, for Site A, and 0.41% and 0.41%, respectively, for Site B. CONCLUSIONS Results obtained thus far demonstrate, with appropriate choices of pulse sequences and acquisition parameters across vendors, 1) signal intensity measures, when corrected for receiver coil sensitivity variations, correlate well with R1, 2) VFA R1 measures correlate well with IR R1 measures, 3) these findings are consistent over short times (“coffee break”) and longer times (1 week), 4) such phantom-based assessment of scanner performance is critical to validate imaging biomarker data from multivendor, multicenter applications. References [1] http://qibawiki.rsna.org [3] http://www.loni.ucla.eduADNI/ [2] http://www.iratnetwork.org [4] http://www.phantomlab.com/magphan_adni.html


![[PDF⚡READ❤ONLINE] Phantom](https://cdn7.slideserve.com/13158923/slide1-dt.jpg)