Download
1 / 73
740 likes | 785 Views
Learn the fundamentals of 3D spectrography and its applications in astronomy, from galaxy formation to black hole dynamics. Discover how 2D spectrography can reveal critical insights into celestial objects. Dive into techniques like long-slit spectroscopy, Fabry-Perot interferometry, and integral field spectrographs. Explore real 3D data reconstruction methods and the benefits of true integral field spectroscopy.

E N D
3D SpectrographyFrom first principles to science Eric Emsellem Centre de Recherche Astronomique de Lyon emsellem@obs.univ-lyon1.fr
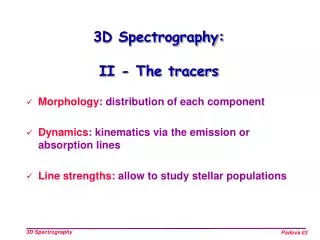
Menu • Basics of 2D spectrography: • Why ? • How ? • What can we trace with 2D spectrography ? • A few illustrations: • Formation and evolution of galaxies (SAURON) • The search for massive black holes • Fueling the central engine • Conclusions
z y x y’ x’ I- Observables ? • SpectrumI(l,x,y,z) Projection y • At a point on the sky • I(l,x’,y’) x Convolution by the PSF • SeeingI(l,x’,y’)
z y x y’ x’ The inverse problem • SpectrumI(l,x,y,z) Deprojection y • At a point on the sky • I(l,x’,y’) x PSF Deconvolution • SeeingI(l,x’,y’)
Objects on the sky are 2D ! saturn M2-9: twi-jet Nebula NASA & ESA Hubble Space Telescope
Objects on the sky are 2D ! The barred galaxy NGC 1365 ESO Very Large Telescope
Objects on the sky are 2D ! NASA & ESA Hubble Space Telescope
Objects on the sky are 2D ! NASA & ESA Hubble Space Telescope Abel 1689
Gas dynamics can reveal SBH Keplerian motion directly trace the SBH mass N 4261 SBH 4.9 108 Mo M 87 SBH 2.4 109 Mo N4261 M87 Need for 2D: an example Gas motion can be non circular • infall or ejection • need 2D spatial coverage IFS
Stars Gas Gas and stars kinematics :the case of NGC 4278 • Feeding SBH • Origin of gas in Ellipticals • Kinematics of stars • SBH mass • shape of potential • Kinematics of gas • origin • transfer of angular momentum
High spatial resolution IFS 2" 1" 0.5" 0.1" 2" 1" 0.5" 0.1"
Why 2D spectrography ? • Objects on the sky are most of the time 2D… • We should limit a priori assumptions • We do have technical solutions for 2D spectrography (who would now think of doing only 1D photometry?) • This extra dimension is often critical… these lectures
How to squeeze 3D in 2D ? • Modern detectors are 2D (optical, near-infrared) • We can thus either fix one spatial or one spectral dimension and scan with time. • This explains the prevalence of long-slit spectrographs, perfectly adapted to modern CCDs.
Zoo of instruments • Scanning spectrographs : • Fabry-Perot interferometer (spectral) • Multi long-slits (spatial) • Fourier Transform spectrometer (frequency) • Real 3D integral field spectrographs : • Fibers • Lenses • Slicers • Real 4-5 D !
Scanning spectrographs • Problems linked with the scanning: • Variation of the Point Spread Function • Variation of transparency • Accuracy of positioning to rebuild the 3D data • Need of relatively bright objects This leads to inhomogeneity in the reconstructed datacubes
Fabry-Perot interferometer • A Fabry-Perot etalon (1901, ApJ 13, 265) acts as a interference filter: • Incidence q • Wavelength l • Index n • Inter plate t
Fabry-Perot interferometers • AAT – Taurus narrow band imaging between 3700 ang. And 1 mm. [http://www.aao.gov.au/local/www/jbh/ttf/history.html] • MOS / FP at CFHT • IFP at the 6m telescope [http://www.sao.ru/~gafan/devices/ifp/ifp.htm] Orion nebula (Bland-Hawthorn / Lee) Mk 573 (Afanasiev)
Multi long-slits time • Spatial scanning with time • Not much used in astronomy: • only a few experiments by e.g. Wilkinson on Centaurus A (1988, MNRAS, 218, 297), and e.g. a group in Japan • The main problem is again the homogeneity of the data as well as the positional accuracy of the slits.
Fourier transform spectrometer • Michelson interferometer: scanning in frequency
Fourier transform spectrometer • FTS Bear at CFHT: 2 arms interferometer The Galactic center (Maillard, Paumard) http://www.cfht.hawaii.edu/Instruments/Spectroscopy/FTS/
Advantage of true IFS • Morphology of real object rarely follows slit geometry • Large spectral range unlike Fabry-Perot (but smaller FOV) • Multiplex advantage • Save telescope time • Homogeneous data • Spatial location and PSF can be measured a posteriori • Spectrophotometry !
NGC 3377 spectrographic 30 mn exposure Datacube Reconstructed image NGC 3377 direct image 2 mn exposure Zoom IFU - Image reconstruction Copin Y., Emsellem E., Bacon R. OASIS March 98 run
TIGER Deconvolved [NII] HST WFPC2 [NII]-H Deconvolution of data cube • IFU datacube is • homogeneous • continuously sampled deconvolution is possible • Lucy deconvolution of each monochromatic image • Guided deconvolution using HST image as a constraint
Fiber fed spectrographs INTEGRAL / WHT
Fiber fed spectrographs • Advantages : • Simplified output into a slit • Possibility to fully use the CCD for the spectral coverage • Disadvantages: • Light losses, performances • Stability of the instrument • Spectrophometry?
The TIGER concept: The trick Uniform illumination at the entrance of the array The array samples the field and focus the light into micro-pupils The array is rotated to avoid overlapping between the spectra The micro-pupils are dispersed via a classical spectrograph A filter limits the Y range
IFU TIGER Lenslet type 1987-1996 at CFHT 400 circular lenslets 0.4 - 0.6 arcsec R=300-2000 (=0.37-1 µm) 52 papers & 8 PHD thesis Spatial Sampling Field of view TIGER 0.39 arcsec 7x5 arcsec² 0.61 arcsec 10x7 arcsec² Spectral Domain 0.35 - 1 µm Spectral resolution Spectral range 400 2400 A 1500 540 A Efficiency Instrument Total 0.07 - 0.12 The IFS TIGER
Solar system Surface and atmosphere of planets Satellite of giant planets Cometary nuclei The Galaxy Stellar jets H2 regions Planetary nebulae Globular cluster Supernovae remnants Galaxies Régions de formation stellaire Cooling flow Active nuclei Dynamics of normal galaxies Interacting galaxies Cosmology Gravitational lenses Radiogalaxies Quasars environnements High z galaxies Scientific Objectives
Long slit TIGER IFU Stellar kinematics of NGC 3115 Stellar Mean Velocity Stellar Velocity Dispersion Emsellem, Dejonghe, Bacon, 99, A&A 305, 495
M31 double nucleus I band s V WFPC2 / HST TIGER / CFHT Bacon, Emsellem, Monnet et al. 94, A&A 281, 691
OASIS The IFS OASIS • IFU OASIS • Lenslet type • 1998-2002 at CFHT • now at WHT (+ NAOMI) • 1200 hexagonal lenslets • 0.04 - 0.3 arcsec (AOB focus) • 0.3-0.5 arcsec (F/8 focus) • R=600-4000 (=0.48-1 µm)
Micropupil exposure Neon Calibration exposure Flatfield exposure Object exposure OASIS Raw Exposures
First light at CFHT - August 97 Central part of the globular cluster M13 30mn exposure - 0.8-1 µm R=1000 FWHM 0.25 arcsec Guiding star V 15.2 (17 arcsec offset)
Study of forbidden lines in T Tauri stars C. Dougados, C. Lavalley, S. Cabrit, F. Menard Morphology and kinematics to constrain excitation conditions, collimation and ejection process Origin of mass loss in young stars • DG Tau, OASIS, Jan 98, 0.45" spatial resolution • RW Aur, OASIS, Dec 98, 0.20" spatial resolution
D. Johnston, G. Mallen-Orlenas, J. Bally & R. Sutherland HST narrow band imaging Low excitation cometary tails pointing directly away from nebula center OASIS observations of proplyds in Orion nebulae (December 98) physical conditions: temperature, density, excitation Ha He NII Protoplanetary disks
Fibers: SILFID, ARGUS, INTEGRAL, … Lenses: OASIS, SAURON, SNIFS Lenses + Fibers: VIMOS, GMOS, PMAS, CIRPASS, GIRAFFE … Scanning FPs: Grif (+AO) Slicers: 3D/MPE, SINFONI, JWST?, MUSE, … In fact: all large telescopes will have at least 1 IFU ! 2D spectrographs: present & future SEE : http://www.aip.de./Euro3D/
Fabry-Perot + Adaptive Optics: Grif GRIF / CFHT
Fiber + Lens: GMOS GMOS / Gemini http://aig-www.dur.ac.uk/fix/projects/gmos/gmos.html
Fiber + Lens: PMAS PMAS : Calar-Alto 16x16 pixels http://www.aip.de./groups/opti/pmas/OptI_pmas.html
Image Slicer: MPE-3D • R up to 2000 • H and K band domains • 16 x 16 pixels field MPE-3D / Calar-Alto Near-Infrared spectrograph Thatte et al. http://www.mpe.mpg.de/www_ir/ir_instruments/3D/main.html
Image Slicer: SINFONI at the VLT SINFONI / VLT – Eisenhauer et al. http://www.eso.org/instruments/sinfoni