Download
1 / 39
390 likes | 400 Views
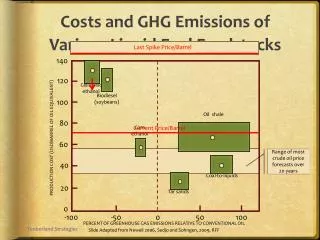
This study analyzes the potential effects of bottlenecks and oil price spikes on the U.S. ethanol industry and agriculture. It examines the impact on crop markets, trade, livestock markets, and world agricultural markets.

E N D
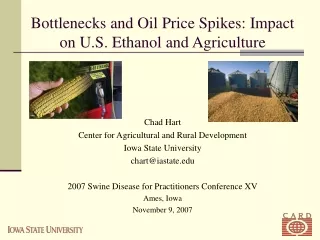
Bottlenecks and Oil Price Spikes: Impact on U.S. Ethanol and Agriculture Chad Hart Center for Agricultural and Rural Development Iowa State University chart@iastate.edu 2007 Swine Disease for Practitioners Conference XV Ames, Iowa November 9, 2007
Outline • Based on an update of our earlier study “Emerging Biofuels: Outlook of Effects on U.S. Grain, Oilseed, and Livestock Markets” http://www.card.iastate.edu/publications/synopsis.aspx?id=1050 • Updated with available 2006 and 2007 data • The objective is to estimate: • how large the biofuels sector in the U.S. could become • the impact of the biofuels sector on crops markets, trade, and on livestock markets • the response of world agricultural markets
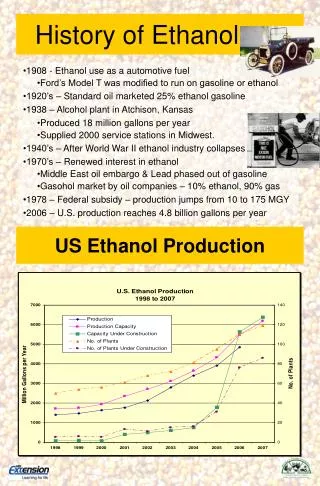
U.S. Ethanol Industry • Current ethanol capacity: 131 plants, 6.92 billion gallons/year • Total capacity under construction and expansion: 6.56 billion gallons/year • 73 new ethanol plants and 10 expansion projects underway • 2.2 billion bushels of corn were used in producing fuel ethanol in 2006/2007 marketing year. • 3.2-3.5 billion bushels of corn are expected to be used in producing fuel ethanolfor 2007/2008 marketing year.
Three Cases • Baseline • Current policies, “normal” weather • Higher oil prices throughout projection period • Adding $10/barrel to the crude oil price • Drought in the 2012 crop year • Placing a 1988-style drought in the middle of the projection period
Projected U.S. Ethanol Production Annual production based on Jan.-July 2007 numbers ~ 6.4 billion gallons
Impact of Higher Crude Oil Price • Increased crude oil price by $10/barrel over the projection • Margins on ethanol plants increase • New incentive to invest in added capacity for ethanol production • Eventually, a new equilibrium reached where there is no incentive to invest in or exit the ethanol industry • Will demand for ethanol be enough? • E-10 market will saturate around 15 billion gallons • Drop in ethanol price will eventually encourage increase in demand for the flex-fuel cars
Impact on Rest of the World • World grain and oilseed prices increase • Result in higher feed and food prices • Higher livestock production cost • Countries in South America and Asia fill the crop gap
Impact of Short Crop Scenario • Drought in 2012 similar to 1988 • Regional yields of corn, soybeans and wheat changed from trend levels • Yields were off by 25% for corn, 18% for soybeans, and 11% for wheat in 1988 • Ethanol mandate for 2012 assumed to be 14.7 billion gallons
Corn, Soybean and Ethanol Markets • Corn price increases by 44% above baseline levels • Soybean price rises by 22% • Corn exports and stock levels decline by more than 60% • Corn exports from South America, China, etc. fill part of the gap from decline in U.S. corn exports • Corn feed use declines by 16% (switch to other feeds) • Ethanol trade increases moderately
Livestock Market • Higher feed costs affect the livestock sector but to a lesser extent as shock is perceived as temporary • Production declines • Broiler production declines the most (over 2.5%) • Milk production declines the least (0.5%)