Biodiversity in Sacred Groves and Coffee Cultivation in Kodagu, Karnataka, India
50 likes | 151 Views
This study explores the biodiversity within sacred groves and coffee plantations in the southern Kodagu district, particularly in Virajpet taluk. It analyzes woody plant diversity, bird populations, and mushroom species across various land use types, including protected areas and sacred groves. Using a systematic sampling design, the research highlights the ecological significance of these habitats in the Western Ghats, contributing to the understanding of conservation strategies and sustainable agriculture in this biodiverse region.

Biodiversity in Sacred Groves and Coffee Cultivation in Kodagu, Karnataka, India
E N D
Presentation Transcript
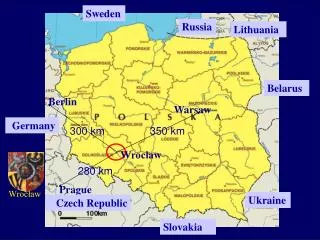
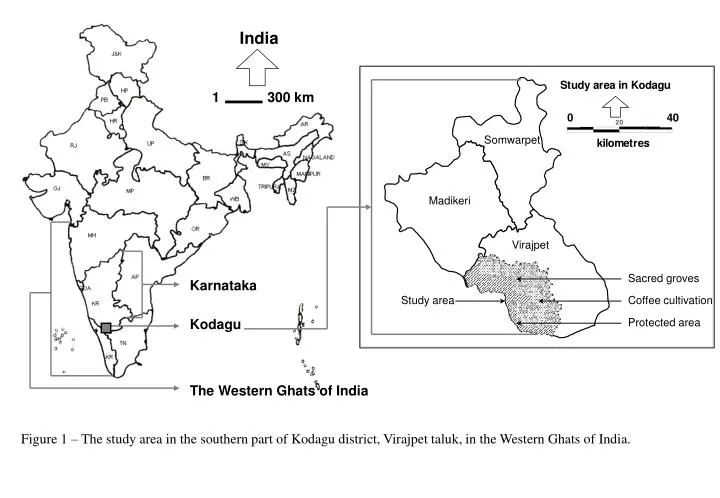
India 1 300 km 0 40 Somwarpet Madikeri Virajpet Sacred groves Karnataka Study area Coffee cultivation Kodagu Protected area Figure 1 – The study area in the southern part of Kodagu district, Virajpet taluk, in the Western Ghats of India. The Western Ghats of India
Figure 2 – Sampling design: A hypothetical sampling locality with a base line running across the patch and the framework of transects placed at random points along the base line, on a randomly chosen side.
28 0 10 29, 48, 49, 50 23 22, 43, 44 Virajpet Kilometres 30, 47 15 21 33 Gonikoppa 56 10 31 55 Ponnampet 9 20 16 19 17, 18, 41, 42 25 3 24, 26, 45 40 13 4, 5 14 39 32 12, 38 27, 46 Legend Srimangala Protected area 34, 35, 57, 58 53, 54 Paddy fields 11, 36, 37 51, 52 7 Sacred groves 1, 2 6 8 Tree-covered land uses including coffee plantations Figure 3 – Landscape map prepared in MapInfo after digitising 42 village land survey maps (scale 1:7920) in one layer. The 58 sampling localities are numbered on the map; 1-10: protected area localities, 11-35: sacred groves, and 36-58 coffee plantations. Sampling localities
For all groups in the diagram Dependent variable Woody Plant Diversity Mean and standard deviation of values of dependent variable Number of observations in a group Percentage frequency distribution of values of independent variable for the group Independent variables Range of values of independent variable for a group of observations Significance value of independent variable Figure 4 – Interpretation of a hypothetical CHAID diagram
Coffee plantations n = 70 Protected area n = 39 Protected area n = 134 Coffee plantations n = 162 10 1 0 5 24 34 19 Protected area n = 97 Coffee plantations n = 86 25 4 96 5 37 14 B 6 A 10 12 20 64 Sacred groves n = 75 11 18 C Sacred groves n = 167 49 Sacred groves n = 142 Figure 5 – Numbers of unique and shared species of (A) trees (≥ 10 cm dbh), (B) birds and (C) mushrooms.