Download
1 / 11
120 likes | 393 Views
TPW: Magnetic Field, Electron Trajectory and Spectra (in presence of Bending Magnets). On-Axis Magnetic Field in Dispersion Section. Upstream BM. Downstream BM. TPW. TPW Field taken from magnetic simulations BM Field is taken from magnetic measurements on a prototype BM with “nose”

E N D
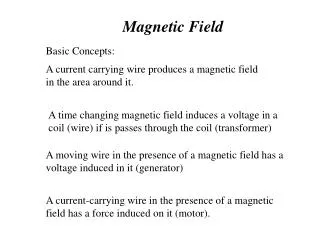
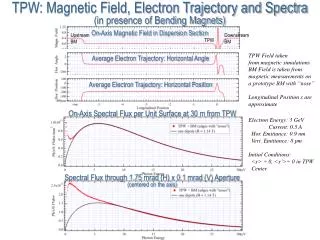
TPW: Magnetic Field, Electron Trajectory and Spectra (in presence of Bending Magnets) On-Axis Magnetic Field in Dispersion Section Upstream BM Downstream BM TPW TPW Field taken from magnetic simulations BM Field is taken from magnetic measurements on a prototype BM with “nose” Longitudinal Position s are approximate Average Electron Trajectory: Horizontal Angle Average Electron Trajectory: Horizontal Position On-Axis Spectral Flux per Unit Surface at 30 m from TPW Electron Energy: 3 GeV Current: 0.5 A Hor. Emittance: 0.9 nm Vert. Emittance: 8 pm Initial Conditions: <x> = 0, <x’>= 0 in TPW Center Spectral Flux through 1.75 mrad (H) x 0.1 mrad (V) Aperture (centered on the axis)
TPW (+ BM) Spectral Flux collected by Finite Aperture (~3 mrad H x 2 mrad V) Centered on the Axis NOTE: “Reference” modeling TPW magnetic field was used in the simulations; changes are still possible (!)
TPW (+ BM) Spectral Flux collected by Finite Aperture (0.33 mrad H x 2 mrad V) at Different Horizontal Angles NOTES: ● Horizontal angle ξx is calculated from straight section axis “towards the storage ring”; the frame origin is in TPW center ● “Reference” modeling TPW magnetic field was used in the calculations; changes are still possible (!) ● Some numerical noise is present in the calculations
Appriximate TPW (+ BM) Radiation Spectral Flux Collected through 6 mrad x 6 mrad Angular Aperture
TPW and BM: Effect of BM Edge Field Profile on Soft X-Ray Radiation Intensity Distributions On-Axis Magnetic Field in Dispersion Section Upstream BM Downstream BM TPW Intensity Distributions in Horizontal Median Plane at 500 eV at 30 m from TPW
Estimating Focusing Efficiency of TPW Radiation Test Optical Scheme Image Plane Aperture TPW Ideal Lens Single-Electron TPW Radiation Intensity Distribution at the Lens (horiz. cut at y = 0), Eph = 3 keV S = 30 m S’ = 1.5 m ● In X-ray domain, intensity distributionsin the image plane are dominated by transverse e-beam size ● At Eph > 3 keV, for horizontal aperture < 0.5 mrad (centered on straight section axis), no important contributions from TPW side poles can be noticed in the image plane Intensity Distributions in the Image Plane Aperture: 90 μrad (H) x 90 μrad (V) “Single-Electron” “Multi-Electron” Aperture: 500 μrad (H) x 200 μrad (V)
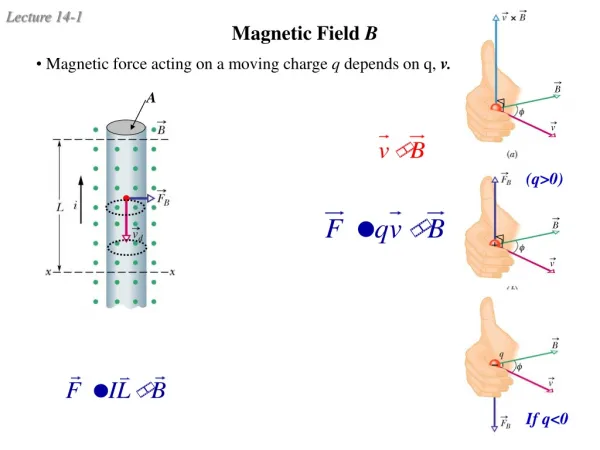
Analyzing TPW and BM Power Density Distributions Magnetic Field Power Density Distribution from different parts of TPW and BM at 30 m (single-electron emission, integral over all photon energies, horizontal cuts at y = 0) θX= 1.5 mrad |θX| = 4.75 mrad θX= 0 |θX| ≈ 2.6 mrad
TPW and BM Power Density Distributions Power Density Distribution (integral over all photon energies) from TPW and BM at 30 m NOTE: modeling TPW magnetic field and BM edge field (without “noses”) were used in these simulations; changes are possible (!) Electron Current: 0.5 A Power Density Distribution from BM Horizontal Cuts at y = 0 Vertical Cuts
TPW and BM Radiation Intensity Distributions (Hard X-rays) Intensity Distributions at Different Photon Energies at 30 m from TPW NOTE: modeling TPW magnetic field and BM edge field (without “noses”) were used in these simulations; changes are possible (!) Electron Current: 0.5 A Horizontal Cuts at y = 0 Vertical Cuts at x = 0
TPW and BM Radiation Intensity Distributions (Soft X-rays) Radiation Intensity Distribution from TPW and BM at 500 eV Photon Energy at 30 m NOTE: modeling TPW magnetic field and BM edge field (without “noses”) were used in these simulations; changes are possible (!) Electron Current: 0.5 A Radiation Intensity Distribution from BM Horizontal Cuts at y = 0 Vertical Cuts at x = 0
TPW+BM Radiation Intensity Distributions (Soft X-Rays to IR) Observation Distance: 30 m Eph= 1 keV Eph= 10 eV Eph= 1 eV Eph= 500 eV Eph= 200 eV Eph= 5 eV Eph= 100 eV Eph= 0.1 eV Eph= 2 eV Eph= 50 eV Eph= 20 eV NOTE: modeling TPW magnetic field and BM edge field (without “noses”) were used in these simulations; changes are possible (!) Electron Current: 0.5 A