Download
1 / 35
350 likes | 521 Views
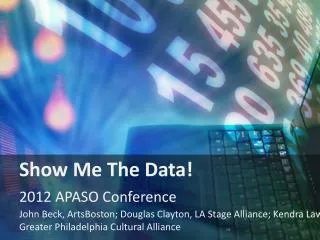
SHOW ME THE DATA! Building a Culture of Evidence and Inquiry. NISOD’S COMMUNITY COLLEGE COMPLETION SUMMIT. POP QUIZ:. What percentage of your entering students need at least one course in developmental education? What percent who need dev ed actually enroll in the course(s)?

E N D
SHOW ME THE DATA! Building a Culture of Evidence and Inquiry NISOD’S COMMUNITY COLLEGE COMPLETION SUMMIT Community College Leadership Program
POP QUIZ: • What percentage of your entering students need at least one course in developmental education? • What percent who need dev ed actually enroll in the course(s)? • What percent complete the dev ed sequence and go on to successfully complete the first related college-level course? • What percent of your entering students do not complete a college credit? Community College Leadership Program
POP QUIZ: • What percentage of your entering students persist to the spring term? • What percentage of your entering students complete a certificate or associate degree? Community College Leadership Program
Atul Gawande • Better • The Checklist Manifesto Community College Leadership Program
A Model for Improvement(100,000 Lives Campaign) • What are we trying to accomplish? • How will we know that a change is an improvement? • What changes can we make that will result in an improvement? • Are we committed to doing more of what we know works? • “The compensatory effect” • i.e., where there are differences in engagement between “high-risk” groups and their comparison groups (academically under-prepared students, students of color, first generation students, nontraditional college age students) --- the high-risk students are more engaged.
A REMINDER… “Some is not a number. Soon is not a time.” Institute for Health Care Improvement Donald Berwick -- 100,000 Lives Campaign
Annual Increase in Degree Production Required to Meet the Goal – 11.7 Million Additional Degrees by 2020 Adjusting for Current Levels of Educational Attainment and Population Growth by State (NCHEMS) What are we trying to accomplish?
American Realities • Between 2000 and 2020, of the projected growth of 56 million in the U.S. population, about 46 million will be members of minority groups. • More than 30 percent of White, non-Hispanic American adults have at least four years of college, compared to only 18 % of African-Americans and 12% of Hispanics.
American Realities • The U.S., long ranked first worldwide, now ranks 9th in the percentage of young adults who hold a college degree. • If current trends hold, the current generation of college-age Americans will be less educated than their parents, for the first time in U.S. history. • American employers are reporting shortages of workers with the skills needed to fill jobs, and there is the growing risk that more and more of those opportunities will be exported to other countries.
Community College Realities • Only 28% of first-time, full-time associate degree-seeking community college students graduate with a certificate or an associate degree within three years. • Fewer than half (45%) of students who enter community college with the goal of earning a degree or certificate have met their goal six years later. • Slightly more than half (52%) of first-time, full-time students in public community colleges return for their second year. • About 14% of entering students in community colleges do not complete a credit in their first academic term.
Community College Realities • Enrollments • Budgets • Unemployment
Community College Responses • “Not all of our students come here to get a degree.” • “Many of our students don’t choose to persist • or graduate.” • “Sure, we could produce better student outcomes, • …if only we had the resources.” • …if only we had better students.”
BUILDING A CULTURE OF EVIDENCE AND INQUIRY Community College Leadership Program
Building a Culture of Evidence • “Take nothing on its looks; take everything on evidence. There’s no better rule.” • — Charles Dickens (1812 – 1870) Great Expectations • “The compensatory effect” • i.e., where there are differences in engagement between “high-risk” groups and their comparison groups (academically under-prepared students, students of color, first generation students, nontraditional college age students) --- the high-risk students are more engaged. Community College Leadership Program
A CULTURE OF EVIDENCE • Institutional and individualreflection and actionare typically prompted and supported by dataabout student persistence,student learning, andinstitutional performance. Community College Leadership Program
INDICATORS OFA CULTURE OF EVIDENCE • Institutional research and information systemsSupport for rigorous examination and open discussion of institutional performance Community College Leadership Program
INDICATORS OFA CULTURE OF EVIDENCE • Student cohort tracking • Systematic collection, analysis, and reporting of key data on student progress and success Community College Leadership Program
INDICATORS OFA CULTURE OF EVIDENCE • Student Outcomes:-Successful completion of remedial/ developmental courses-Progress from remedial/ developmental courses to college-level courses-Successful completion of selected gatekeeper courses (e.g., College Algebra, Anatomy & Physiology, etc.) Community College Leadership Program
INDICATORS OFA CULTURE OF EVIDENCE • Student Outcomes:- Rate of successful course completion for all courses (grade of C or better)-Student persistence – re-enrollment term-to-term-Completion of certificates and associate degrees Community College Leadership Program
INDICATORS OFA CULTURE OF EVIDENCE • Routine disaggregation and reporting of data by age, race/ethnicity, gender, and income level • Regular assessment of educational practices Community College Leadership Program
INDICATORS OFA CULTURE OF EVIDENCE • Routine use of assessment results to inform institutional decisions (e.g., priority-setting, resource allocation, professional development, improvements in programs and services for students) Community College Leadership Program
INDICATORS OFA CULTURE OF EVIDENCE • Evidence-based assertions and beliefs about “what works” in promoting student learning and attainment Community College Leadership Program
The Courage to See… Community College Leadership Program
COMMUNITY COLLEGE INVENTORY • Where do we stand? Community College Leadership Program
Discussion Questions: • What is something that people in your college may believe but which is factually untrue? Community College Leadership Program
Discussion Questions: • What is an important unspoken truth about the student experience in your college? Community College Leadership Program
Discussion Questions: • What gets in the way of building a culture of evidence in your institution? Community College Leadership Program
LEADERHIP CHALLENGE • Resisting the Average/ • Reaching for Excellence: • (How good is good enough?) • “The compensatory effect” • i.e., where there are differences in engagement between “high-risk” groups and their comparison groups (academically under-prepared students, students of color, first generation students, nontraditional college age students) --- the high-risk students are more engaged. Community College Leadership Program
BARRIERS TO AN EFFECTIVE STUDENT SUCCESS AGENDA Community College Leadership Program
BARRIERS • Lack of institutional research capacity • Avoidance of tough issues (e.g., race, class) • Failure to sustain focus over a long period • Lack of committed and effective leadership Community College Leadership Program
BARRIERS • Absence of collaborative culture • Overload and competing priorities • Project mentality • Resistance to change Community College Leadership Program
BARRIERS • Absence of strategic planning • Difficulty in going to scale • Unwillingness to reallocate resources • Lack of board engagement and support Community College Leadership Program
“BETTER IS POSSIBLE…” “…It does not take genius. It takes diligence. It takes moral clarity. It takes ingenuity. And above all, it takes a willingness to try.” -- Atul Gawande
SHOW ME THE DATA! Building a Culture of Evidence and Inquiry Kay McClenney and Byron McClenney Community College Leadership Program (use only with appropriate citation) NISOD’S COMMUNITY COLLEGE COMPLETION SUMMIT Community College Leadership Program