Download

1 / 31
310 likes | 496 Views
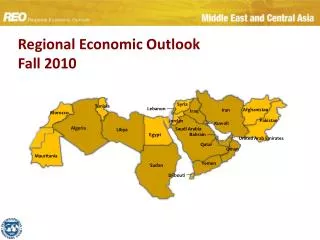
Regional Economic Outlook Fall 2010. Syria. Tunisia. Lebanon. Afghanistan. Iran. Iraq. Morocco. Pakistan. Jordan. Kuwait. Algeria. Saudi Arabia. Libya. Bahrain. Egypt. United Arab Emirates. Qatar. Oman. Mauritania. Yemen. Sudan. Djibouti.

E N D
Regional Economic OutlookFall 2010 Syria Tunisia Lebanon Afghanistan Iran Iraq Morocco Pakistan Jordan Kuwait Algeria Saudi Arabia Libya Bahrain Egypt United Arab Emirates Qatar Oman Mauritania Yemen Sudan Djibouti
Global outlook: Two-speed recovery in motion Real GDP Growth (percent change from a year earlier) Temporary slow-down 2010:H2 — 2011:H1 Emerging economies World Advanced economies 2000 02 04 06 08 10
A closer look at the two-speed recovery Real GDP Growth (percent change from a year earlier)
Rebalancing is needed along two dimensions Demand from external surplus economies Demand from external deficit economies Private demand Public demand
Downside risks remain, but global double-dip unlikely Prospects for World GDP Growth (percent change)
Inflationary pressures are forecast to remain subdued Core Inflation (Twelve-month change in the core CPI) For countries with a peg to the USD or euro, this means that higher inflation rates may lead to real appreciation. 2002 04 06 08 Jul.10
Oil demand is accelerating with the broadening of the global recovery but supply buffers are still substantial Oil Demand Growth (contributions to y-o-y growth in percent) Total demand
Temporary Wheat Supply Shock, Limited Spillovers Major Food Crops, Nearest Futures Prices (index, Jul. 1, 2010 = 100) Wheat Corn
Capital Flows, Reserves, Appreciation Net Monthly Flows to Emerging Market Equity Funds (billions of U.S. dollars) Net Monthly Flows to Emerging Market Bond Funds (billions of U.S. dollars) Sep. 10 Sep. 10 9
MENAP Oil Exporters Iran Iraq Kuwait Algeria Saudi Arabia Libya Bahrain United Arab Emirates Qatar Oman Yemen Sudan
Global demand recovers, boosts activity Sources: National authorities; and IMF staff estimates. MENAP Oil Exporters
…and external balances rebound $257 $107 $124 $101 $75 $31 $23 $5 -$7 -$7 -$6 -$10 Sources: National authorities; and IMF staff estimates. MENAP Oil Exporters
…as do fiscal balances Sources: National authorities; and IMF staff estimates. MENAP Oil Exporters
Many countries approaching break-even prices Average oil price in 2010 Sources: National authorities; and IMF staff estimates. MENAP Oil Exporters
Some countries continue to provide stimulus Percent change in total government expenditures in U.S. dollars(From 2008 to 2011) Sources: National authorities; and IMF staff estimates. MENAP Oil Exporters
Keep an eye on inflation Source: National authorities. 1Algeria, Bahrain, Iraq, Kuwait, Libya, and Oman MENAP Oil Exporters
Financial sectors after the crisis (December 2009) Source: National authorities. 1December 2008 MENAP Oil Exporters
Policy priorities MENAP Oil Exporters
MENAP Oil Importers Syria Tunisia Lebanon Afghanistan Morocco Pakistan Jordan Egypt Mauritania Djibouti
Trade recovery is moving ahead Annual percent change of U.S. dollar value, 3-month moving average Region’s exports are again growing steadily Sources: National authorities; IMF Direction of Trade Statistics; and Haver Analytics.¹ Egypt, Jordan, Lebanon, Morocco, Pakistan, and Tunisia. MENAP Oil Importers
Real GDP picking up across region Annual percentage change 2011 Source: National Authorities; and IMF staff estimates. MENAP Oil Importers
Progress in fiscal consolidation Source: National Authorities; and IMF staff estimates and projections. MENAP Oil Importers
Most can maintain current monetary stance Consumer Prices; annual percentage change Aug-10 Sources: Haver Analytics; and national authorities. MENAP Oil Importers
More than 18 million jobs needed Dominique Strauss-Kahn: “We must not underestimate the daunting prospects we face: a lost generation, disconnected from the labor market, with a progressive loss of skills and motivation.” AFP/ABDELHAK SENNA/Getty Images. Reprinted with permission. (Unemployed workers wait for a job in the BaniMakada quarter of Tangiers, Morocco on March 20, 2004.) MENAP Oil Importers
High unemployment a long-standing issue Sources: National authorities; IMF, World Economic Outlook; staff estimates; and International Labor Organization. Note: MENA6 refers to Egypt, Jordan, Lebanon, Morocco, Syria, and Tunisia. Youth unemployment estimate for MENA6 excludes Jordan. Data refers to 2008 or latest available year. MENAP Oil Importers
Growth and export gaps: getting bigger Goods exports (in percent of GDP) Source: IMF, World Economic Outlook. MENAP Oil Importers
Competitiveness will need to improve Competitiveness Rankings, 2010–11¹ Source: World Economic Forum, Global Competitiveness Report, 2010–11. ¹Economies are ranked from 1 to 139, with first place being the best. MENAP oil importers is a simple average ofEgypt, Jordan, Lebanon, Mauritania, Morocco, Pakistan, Syria, and Tunisia. Emerging Asia is simple average of China, Hong Kong SAR, India, Indonesia, Korea, Malaysia, the Philippines, Singapore, Taiwan Province of China, Thailand, and Vietnam. MENAP Oil Importers
Broader Partnerships Real GDP trends, annual percent change Asia Latin America Advanced economies 05 15 85 95 10 90 2000 1980 Source: IMF, World Economic Outlook database. Note: 1980-2015 real GDP growth data are de-trended as 10-year backward rolling averages. MENAP Oil Importers
Policy priorities MENAP Oil Importers