Supplementary Figure 1 . Somatic mutation spectrum
110 likes | 301 Views
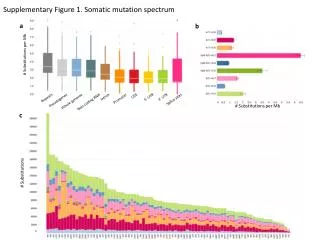
Supplementary Figure 1 . Somatic mutation spectrum. a. b. # Substitutions per Mb. CDS. Intron. 5’ UTR. 3’ UTR. Repeats. Promoter. Splice sites. Pseudogenes. Whole genome. Non-coding RNA. # Substitutions per Mb. c. # Substitutions. DFS. 1.0. 0.8. 0.6. Survival Probability.

Supplementary Figure 1 . Somatic mutation spectrum
E N D
Presentation Transcript
SupplementaryFigure 1. Somatic mutation spectrum a b # Substitutions per Mb CDS Intron 5’ UTR 3’ UTR Repeats Promoter Splice sites Pseudogenes Whole genome Non-coding RNA # Substitutions per Mb c # Substitutions
DFS 1.0 0.8 0.6 Survival Probability 0.4 0.2 p = 0.136 0.0 20 40 60 80 100 120 Months Supplementary Figure 2. TP53 mutations associated with chromosomal instability and clinical variables c. CIN ( p = 3.12e-05) a. p53 wild type: n=51 p53 mutation: n=31 b. Tumour Grade ( p = 0.0075)
Supplementary Figure 3. Alignment of the mutations in kinase domains of JAK1, JAK2, JAK3 and ERBB2 Nucleotide-binding ATP-binding JAK1: Q644H,V645F JAK1:L910P ERBB2: L755P,S ERBB2: G776S V777A,L,M JAK1: S703I ACRG-HCC mutation ACRG-HCC mutation (recurrent) Known mutation Known mutation (recurrent) Known mutation (activating) Known mutation (resistant)
Supplementary Figure 4. JAK inhibitors inhibit JAK1 S703I mutant-mediated activation of p-STAT3 in Ba/F3 cells Ruxolitinib BMS-911543 DMSO pStat3 Stat3 Actin
Supplementary Figure 5. Frequencies of copy number gain and loss for chromosomal arms % Tumour Samples
Supplementary Figure 6. Selective amplification and deletion of cancer genes a CNV Regions Non-CNV Regions G-score Amplification Oncogene Oncogene Other Tumor Suppressor Other Tumor Suppressor b CNV Regions Non-CNV Regions G-score Deletion Oncogene Other Oncogene Tumor Suppressor Other Tumor Suppressor
Supplementary Figure 7. Overview of cancer pathways impacted by genomic alterations No Change Amplification Up Regulation Mutation Deletion Down Regulation
Supplementary Figure 8. Genomic alterations of key genes and pathways across three subclasses S1 S2 S3 Alteration Status Not altered Pathway alteration Mutation Deletion Amplification HBV Integration
Supplementary Figure 9. Somatic SNV detection work flow Performed on tumour and normal separately QC sequence reads Map to reference genome hg19 (SOAP2) Collect read support info on all sites Predict mutant alleles in tumors (SOAPsnv) Tumor vs. Normal mutant allele frequency Fisher’s Exact test p < 0.01 Y Y Read Support Binomial test p > 0.01 Quality Score Wilcoxon rank sum test p > 0.01 Y Read Depth ≥ 10 Y Mutant allele enriched in repeatedly aligned reads? Mutant allele enriched within 10 bps of read ends? Y Mutant allele frequency difference ≥ 20% N N Predicted somatic mutation Sequenom validation 497


