Download
1 / 47
470 likes | 676 Views
Assessing the Value and the Impact of the Performing Arts in the U.S.A. Presenting and Performing Organizations. 1. What do Americans think about attending live performance?. Do the performing arts improve the quality of life in your community?.

E N D
Assessing the Value and the Impact of the Performing Arts in the U.S.A Presenting and Performing Organizations
1. What do Americans think about attending live performance?
Do the performing arts improve the quality of life in your community?
Do the performing arts contribute to the development and education of children?
Two Groups of Focus: 1. Not for profit presenting organizations
Non-Profit Organizations • All money earned goes directly back into the organization
For-Profit Organizations • All money earned is distributed amongst the investors
Category 2 • Non for profit producing groups
Four Categories of Presenting Organizations 1. University Presenters 2. Large and Medium- sized Performing Arts Centers 3. Small arts organizations presenting primarily new works 4. Culturally specific organizations
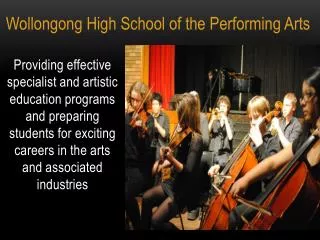
University Performing Arts Centers Main funding comes from two areas: • The University • Ticket Sales
Performing Arts Centers • Private Foundations • Ticket Sales 30 – 50% • Government Grants (NEA)
Small Arts Organizations • Foundations • Individuals • City and State Organizations • Ticket Sales (14%)
Culturally Specific Organizations • Small budgets • Volunteer Based
Symphonies • Total number of concerts performed in the last decade rose 30% • Between 2003-2004 orchestras performed more than 36,000 concerts • 17,000 were educational • Generated $1.7 billion in revenue
Increased Concerts Endowments Private Contributions Other earned income Decreased Income from government grants Income Percentages
Classical Music • Over half of the audience at traditional concerts is over the age of 55 • 12% attended a classical performance in 2002 • 25% listened to one on the radio • 45-64 year olds are most likely to attend performances
Theatre • 61% of the 1,447 theatres looked at have budgets of $250,000 or less • Non-profit theatres contributed over $1.6 billion to the U.S. economy
Facts on Theater • Theatres profiled in 2004 filled an average of 71% of their seats with paying customers • Subscription prices have risen 21% • While ticket prices have risen 24% • Foundation money declined each year
Dance • Northeast and West regions of the U.S. have the largest concentration of dance companies
Income • Grants • Auctions • Contributions • Ticket Sales
Opera • Only 10% of patrons would not be interested in trying a new opera • 40% of these were in their 40s • 25% were eager to attend new and rare performances • 80% of opera goers will see the same opera twice
Subscriptions • Support and sustain the arts • Preferred seating • Advanced Planning
Factors Contributing to Rise • Increasing quality of electronically reproduced substitutes for live performances • Rising costs of attending a live performance • Preference for home-based leisure activities • Flexibility in schedules
Mid-sized Organizations • Strong, on-going programming • Reduction of wage growth • Avoidance of new works to avoid royalty payments • Choosing productions that require fewer artists and/or scene changes • Cutting rehearsal times • Targeting niche audiences with a predictable, loyal audiences
Education • Live arts in the schools have not been a priority in many states • Exposure to the arts at a young age coupled with a sound general education will result in increased arts attendance
Finance • Larger organizations are more likely to sustain themselves • Smaller organizations experienced decreased audiences and fewer donations after 9/11
Political State • The current government's push for homeland security has made people fearful
The Future • A recognition and respect for global interdependence
Spasibo Thank You