Download
1 / 1
10 likes | 113 Views
Fig. 5 S-33/k isotherm compared with compressed natural gas and DOE Target. Fig. 6 PSD determined from methane isotherm. This shows a predominance of nanopores with width around 1.1 nm. Conclusions : The results of the equilibration and outgassing experiments have enabled

E N D
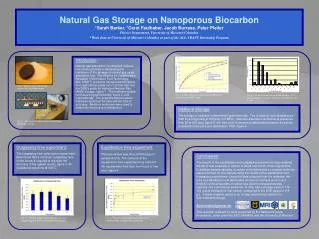
Fig. 5 S-33/k isotherm compared with compressed natural gas and DOE Target Fig. 6 PSD determined from methane isotherm. This shows a predominance of nanopores with width around 1.1 nm. Conclusions: The results of the equilibration and outgassing experiments have enabled the lab to test a sample of carbon in about one-fourth of the original time. In addition several samples of carbon were tested and a complete isotherm was performed on one sample using the results of the equilibration and outgassing experiments. Using the data collected from the isotherm, the pore size distribution and deliverable amount of methane were found. Analysis of the properties of carbon has lead to increased storage capacity. Our current best performer, S-33/k, has a storage value of 115- 119 grams methane for liter carbon, compared to the DOE target of 118 g/L. Further analysis needs to be to help optimize the carbons for both methane storage. Acknowledgements: This research is based on work supported by the National Science Foundation, under grant No. EEC-0438469, and the University of Missouri. Natural Gas Storage on Nanoporous Biocarbon*Sarah Barker, *Carol Faulhaber, Jacob Burress, Peter PfeiferPhysics Department, University of Missouri-Columbia*Work done at University of Missouri-Columbia as part of the ALL-CRAFT Internship Program Introduction: Natural gas adsorption on activated carbons has shown promise in addressing the limitations of the storage of natural gas as an alternative fuel. The Alliance for Collaborative Research in Alternative Fuel Technology, ALL-CRAFT, produces nanoporous biocarbon from agricultural waste corn cob that has met the DOE’s goals for Adsorbed Natural Gas (ANG) storage, figure 1. The methane uptake is measured gravimetrically, figure 2, and volumetrically. The experimental procedure has been optimized for time without loss of accuracy. Methane isotherms were used to determine the pore size distribution. Fig. 1: Missouri corn cob starting material and finished briquette. Methane Storage: The storage of methane is determined gravimetrically. This is done at room temperature (293 K) and typically at 500 psig (3.5 MPa). Methane adsorption isotherms at pressures from 25 to 500 psig, figure 5, are also done to determine deliverable pressure as well as to determine the pore size distribution, PSD, figure 6. Fig. 2: Gravimetric sample cell and methane adsorption set-up. Equilibration time experiment: This experiment was done at 500 psig on sample B-21/k. The outcome of the equilibration time experiment has reduced the equilibration time from four hours to one hour, figure 4. Outgassing time experiment: The outgassing time optimization experiment determined that a minimum outgassing time of two hours is required to maintain the accuracy of the uptake results, figure 3. All outgassing was done at 400°C. Fig. 4: This plot shows that the 1 hour is the minimum time needed for equilibration Fig. 3: This bar graph shows that the two hour outgassing time is the minimum time required.