Download
1 / 15
150 likes | 239 Views
Whole Genome Approaches to Cancer. 1. What other tumor is a given rare tumor most like? 2. Is tumor X likely to respond to drug Y?. Oligonucleotide Arrays. 300,000 25-mer probes in situ photolithographic synthesis single color hybridizations chips available for 40,000 human genes

E N D
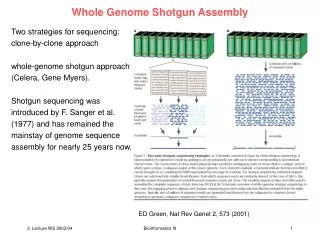
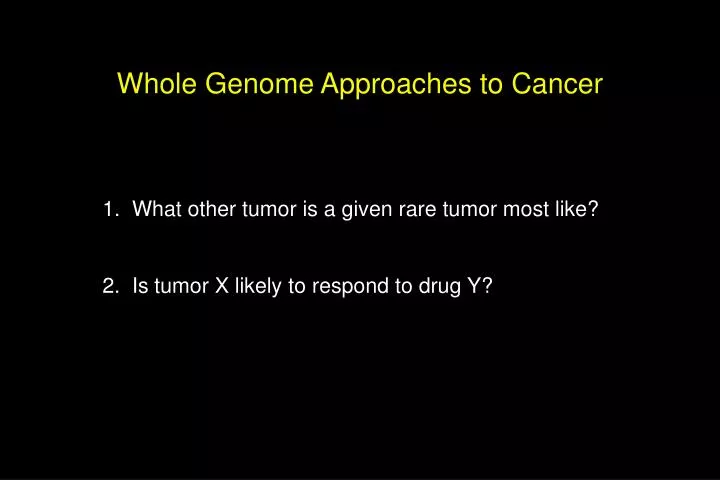
Whole Genome Approaches to Cancer 1. What other tumor is a given rare tumor most like? 2. Is tumor X likely to respond to drug Y?
Oligonucleotide Arrays • 300,000 25-mer probes • in situ photolithographic synthesis • single color hybridizations • chips available for 40,000 human genes • and 25,000 murine genes 1.28cm 1.28 cm
1 2 3 Genes 24 microns 106 oligos match mismatch n 1 2 ... ..20 Gene n coding 3’ UTR
Estimating Message Abundance 1 2 3. . . . . .20 perfect match (PM) mismatch (MM) Message abundance = trimmed mean (PM1-MM1 . . .PM20-MM20) • Confidence measure: • ‘A’ low confidence • ‘P’ high confidence
Oligonucleotide Arrays: Sample Preparation TTT-T7 AAA TTT-T7 AAA-T7 RT 10 mg total RNA cDNA ds cDNA IVT bio-NTPs B B TTT scan hyb SAPE SA ion argon laser B B chip cRNA computer
‘P’ calls (2301) Reproducibility Experiments Same Target on 2 Arrays ‘A’ calls (4830) 100000 +2X +2X -2X -2X 10000 1000 100 100 1000 10000 100000
Cancer Classification Class Prediction ClassDiscovery Identify previously unrecognized classes Assign new tumors to known classes Type 2 Type 1 Type 3 Type 1 Type 2 Type 3
Proof of Concept: Acute Leukemia Diagnosis ALL AML Molecularly distinct tumors are morphologically similar
Permutation Test Terminal transferase Myelo- peroxidase 1000 genes more highly correlated than expected Gene Expression Correlates of Leukemia Genes sorted according to correlation with ALL/AML distinction ALL AML genes low high normalized expression
Biotin label RNA 6800 gene arrays Remove each sample in turn Randomly withhold one sample Sort genes by degree of correlation with ALL vs. AML Choose most highly correlated genes Error Rate Predict class of withheld sample Proof of Principle: ALL vs. AML Distinction 38 pre-treatment marrows (ALL or AML) No leukemia cell purification 3-10 mg total RNA per sample Results Initial set (n=38) 36 predictions 2 uncertain 100% correct Independent set (n=34) 29 predictions 5 uncertain 100% correct
Golub et al., Science, 1999 Class Discovery What if ALL/AML distinction was not previously known? Could we discover it by expression alone? Cluster by SOM 38 samples T-ALL B-ALL AML
Lymphoma Outcome Prediction: All patients (n=58) M. Shipp, J. Aster predicted ‘good’ Can a gene expression-based model ‘learn’ how to predict treatment response? predicted ‘bad’ p = 0.0003
Choose pair of sens/resistant within each tissue type Build best model Test on remaining samples Chemosensitivity Prediction: NCI-60J. Staunton,J. Weinstein • panel of 60 human cancer cell lines • known sensitivity to 000’s of compounds • we measured expression of 6800 genes in untreated cells Are gene expression patterns sufficient to predict sensitivity?
Expression-Based Prediction 50 Kolmogorov-Smirnov p = 10-24 40 30 Number of Drugs 20 10 0 % Accuracy
First Generation Global Cancer Map S. Ramaswamy BR PR CO CNS LY ME LEU RE PA genes 300 tumors and normals 27 tumor classes 13,000 genes/ESTs