Download
1 / 27
270 likes | 441 Views
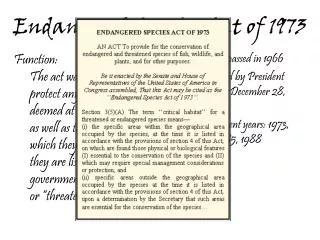
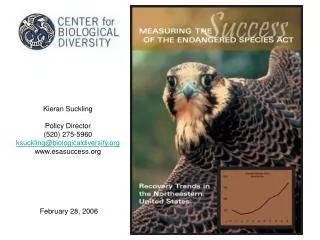
Kieran Suckling Policy Director (520) 275-5960 ksuckling@biologicaldiversity.org www.esasuccess.org February 28, 2006. Endangered Species Act Precursor created in 1967 Current law created in 1973 1,312 plants and animals currently listed as threatened or endangered

E N D
Kieran SucklingPolicy Director(520) 275-5960ksuckling@biologicaldiversity.orgwww.esasuccess.org February 28, 2006
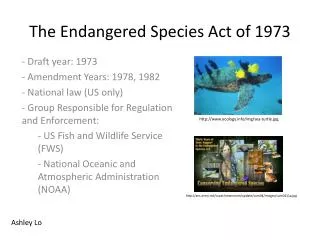
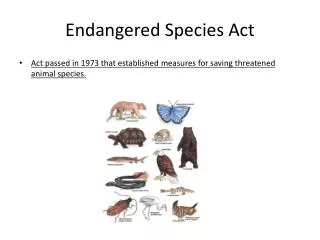
Endangered Species Act Precursor created in 1967 Current law created in 1973 1,312 plants and animals currently listed as threatened or endangered 1,350 historically listed Purpose: 1. Prevent extinction 2. Move species toward recovery 3. Achieve full recovery and remove from endangered list
Is the Endangered Species Act Working? • Prevent extinction • 2. Move toward recovery • 3. Achieve full recovery ● 52 listed species potentially extinct, but… ● Only 21 (1.5%) disappeared after listing, and… ● Only 2-5 savable at the time of listing ● ESA at least 99.6% successful by this measure
Is the Endangered Species Act Working? • Prevent extinction • 2. Move toward recovery • 3. Achieve full recovery ● 52 listed species potentially extinct, but… ● Only 21 (1.5%) disappeared after listing, and… ● Only 2-5 savable at the time of listing ● ESA at least 99.6% successful by this measure ● 14 species fully recovered and removed from endangered list ● ESA is 1.0% successful by this measure
Is the Endangered Species Act Working? • Prevent extinction • 2. Move toward recovery • 3. Achieve full recovery ● 52 listed species potentially extinct, but… ● Only 21 (1.5%) disappeared after listing, and… ● Only 2-5 savable at the time of listing ● ESA at least 99.6% successful by this measure ● 97.5% not extinct or recovered ● population trend anecdotes (bald eagle, grizzly bear, etc.), but no comprehensive data… ● until this report ● 14 species fully recovered and removed from endangered list ● ESA is 1.0% successful by this measure
56 endangered species in Vermont, Maine, New Hampshire, Massachusetts, Connecticut, Rhode Island, New York and New JerseyWe gathered long-term population trend data on the 53 which were listed for at least six yearsWe reviewed federal recovery plans to determine which species were expected to recover by 2005 and which were not expected to recover that soon
Goal 1: Preventing Extinction Four extinct or extirpated from the U.S. before listing None became extinct after listing Eastern Cougar Longjaw Cisco Listed: 1974 Last documented: early 1940s Listed: 1974 Extirpated from U.S.: 1967 Eskimo Curlew Blue Pike Listed: 1974 Last documented: 1963 Listed: 1974 Extinct: 1971
Goal 2: Full Recovery Critics: all 1,350 species should have recovered, thus “The ESA has a 1% success, 99% failure rate” (Richard Pombo) How many should have recovered? Federal recovery plans: require an average of 42 years for recovery actions Listing length: species on endangered list for 24 years on average Expected recoveries: federal recovery plans predict 11 recoveries by 2005 Actual recovery record: nine species downlisted, delisted, proposed for delisting, or under consideration for delisting
Goal 3: Moving Species Toward Recovery Increased since listing: 65% (=26) Remained stable: 28% (=11) 93% (=37) increased or remained stable Declined since listing: 8% (=3) Unknown trend: 9 Extinct/extirpated before listing: 4
Three species (=7%) declined Indiana Bat In dramatic decline at time of listing, continued to decline for another 25 years, began improving about 1996 American Hart’s Tongue Fern Declined score based primarily on NY which contains most U.S. plants. But most of species is in Canada where it is stable.
Three species (=7%) Declined The large Chesapeake Bay populations have declined rapidly since listing. They have received little institutionalized habitat protection. The two small Connecticut River metapopulations have increased in size due to intensive habitat management and a reintroduction program. Puritan Tiger Beetle