Download
1 / 27
270 likes | 377 Views
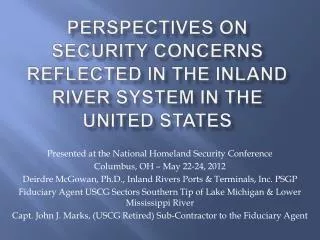
This presentation, delivered at the National Homeland Security Conference, discusses the security implications related to the inland river system in the United States. The inland waterway, primarily along the Mississippi River, serves as a vital transportation route for various goods. The efficient nature of river transportation is highlighted, showcasing how barges can move large quantities of cargo with minimal fuel consumption compared to rail and trucks. The presentation outlines the unique security concerns, including potential disruptions like high and low water events, bridge collapses, and lock failures. Addressing these concerns is crucial as any disruption in the flow of cargo along the river system can have significant economic and security impacts on the supply chain and the overall economy. Various scenarios, such as low water events in 2005 and high water challenges in 2011, underscore the importance of safeguarding the river system against natural and man-made threats. The presentation also stresses the need for proactive measures to ensure the continuity of commerce and security along the inland waterways.

E N D
Perspectives on Security Concerns Reflected in the Inland River System in the United States Presented at the National Homeland Security Conference Columbus, OH – May 22-24, 2012 Deirdre McGowan, Ph.D., Inland Rivers Ports & Terminals, Inc. PSGP Fiduciary Agent USCG Sectors Southern Tip of Lake Michigan & Lower Mississippi River Capt. John J. Marks, (USCG Retired) Sub-Contractor to the Fiduciary Agent
America’s inland waterway, concentrated along the Mississippi River, is often referred to as her “Fifth Coast” and is a major transportation artery, moving 624 million tons of cargo along 12,000 miles of commercially navigable channels, through 240 lock sites. • Map of Inland System
Waterways transport more than 60% of the nation’s grain exports, 22% of domestic petroleum and 20% of the coal used to generate electricity. Utilizing the River is the most fuel efficient, safest mode of transportation. • Marad Cargo Capacity
A barge can move a ton of cargo 576 miles for each gallon of fuel expended. That’s a much better average than rail (413 miles) and trucks (155 miles). One hopper barge, for example, carries 1,750 short tons of dry cargo. To move this same cargo by rail would require 16 rail cars or 70 tractor trailer trucks. As for liquid, a single inland tank barge can carry 27,500 bbls of gasoline. The same cargo would require 46 rail cars or 144 tanker trucks.
Diverted to Highways, truck traffic would double on our interstate highway system.Rail tonnage would jump by 25%
In the event of an incident affecting any of the deep-water ports, critical freight deliveries can be shifted to another port. This is not true with the inland river system. If the river is blocked or diverted, the bottlenecks would create havoc.Consequently, there are unique security concerns generated by our river system. It doesn’t matter whether disruption is inflicted by natural or man-made circumstances. Any disruption of transit on the waterways would have far-reaching impact on our supply-chain and, by extension, the economy as a whole. Among these are: High / Low water Bridge collapse Lock Failure
LOW WATERAn Inch of Water: What’s it worth? A barge needs a certain amount of water in order to float and not touch bottom. A vessel’s water depth is called the “draft”. The more cargo a barge carries, the more it will weigh, meaning it will displace more water and require more draft. The draft (or draught) of a ship’s hull is the vertical distance between the waterline and the bottom of the hull (keel), with the thickness of the hull included. Even a slight decrease in the depth of a waterway will require a barge to reduce the amount of cargo it is carrying. On the flip side, more water means more cargo. This, in turn, translates into fewer trips being needed to transport goods. Consequently, an average of one foot reduction in the deep draft channel creates an additional loss to the U.S. Economy of $1.47 billion per foot in direct spending.
Low Water Event of Summer, 2005 A prolonged period of below normal rainfall that began after the January 2005 drought brought river elevations to some of their lowest levels in recent years. Both the Mississippi and Lower Ohio Rivers were low enough to affect river transportation. A barge passes by sandbars in the Ohio River near Paducah, KY in mid-August. Photo taken from Fort Massac State Park in Metropolis, Illinois. The Interstate 24 bridge is visible.
There are 84,000 dams in the United States, and millions of people live behind the dams or levees. New tools, such as the DSAT (Dams Sector Analysis Tool) can project the extent of projected flooding – but it’s tough to project the long term impact of the flooding of 2011 – as shown in the slides that follow:
HIGH WATER High water brings another, unique set of challenges. Pictured below, the towboat “Jock” pushes a load of barges containing light cycle oil, in the Mississippi River, underneath the bridge connecting Natchez, MS to Vidalia, LA, May 21, 2011.
A barge travels down the Mississippi River past a flooded business near Natchez, MS, May 17, 2011. During this time the USCG closed the River because barge traffic could increase pressure on the levees.
A barge is moored along the flooded Mississippi River in Vicksburg, MS, May 19, 2011.
Why are high and low water events on the River a topic of discussion at a Homeland Security Conference? After all, these are the result of Natural Forces, not what we consider traditional Homeland Security issues.Because: Disruption of the supply-chain can have far-reaching implications, both economic and security. When that chain was interrupted in Japan in 2011 by the combination of the earthquake and the tsunami, it interrupted not only manufacturing in that country it also interrupted needed supplies for manufacturing of automobiles, telecommunications and consumer electronics in the United States. The inland river system transports major components of our nation’s supply chain.
Commerce to and from 38 states moves through the port complex in south Louisiana. Coal from West Virginia, corn from Iowa, fertilizer from Florida, petroleum products from Texas, and aggregate materials from Arkansas are transported through these ports. More than 6,000 ocean going vessels and more than 450 million tons of cargo move through the mouth of the Mississippi River annually.The US Balance of Trade depends on transit along the Mississippi and exports from Port New Orleans, where over $40.12 billion in exports and $62.75 billion in imports were transported. That included 60% of all grain exports.
A recent study by the Texas Transportation Institute looked at the hypothetical impact of a complete shut-down of the Mississippi and Illinois Rivers and its impact on the vicinity of St. Louis. The study used FHA models to determine the estimated shifts of millions of tons of cargo from the inland river system to the city’s interstate highways.Highway costs over the next ten years would increase form $345 million to over $721 millionTruck congestion on the St. Louis roadways would increase 200% with traffic delays jumping 500%Injuries and fatalities on the interstates rising from 36 – 45 %Maintenance costs growing from 80 – 93% We can’t afford a shut-down of the inland waterway!
Another security/economic concern is a bridge collapse, regardless of cause. Bridge debris in the River could block it for a substantial amount of time adversely impacting road traffic as well. There are more than 600,000 bridges in the United States that are 20 feet long or longer, some over a century old and many of them national iconic monuments. Research is underway to determine how materials, connection details and designs in aging bridges react to IEDs, other explosives, kinetic impact, intense fires and other accidents.
There are an estimated 18,000 bridges in the United States that are classified as fracture-critical bridges requiring continual inspections. It is estimated 26% are either structurally deficient or functionally obsolete, according to the American Society of Civil Engineers.
In December 1967, the Silver Bridge connecting Point Pleasant, WV and Kanauga, OH, collapsed.
In June of 1983, the Minanus Bridge at Greenwich, CT, part of the Connecticut Turnpike, aka Route 95, collapsed.
Then, there was the tragedy in Minneapolis in 2007 This bridge collapsed in 13 seconds
Of genuine concern is the looming consequence of an earthquake along the New Madrid Fault.
During the 1812 New Madrid Earthquake: Some sections of the Mississippi River appeared to run backward for a short time. Sand blows were common throughout the area, and can still be seen from the air in cultivated fields. The shock waves propagated efficiently through the firm Midwestern bedrock, and were felt by residents as far away as Pittsburgh, Pennsylvania, Norfolk, Virginia, Boston, and Toronto. Sidewalks were reported to have been cracked and broken in Washington, D.C. “It was what we call a thrust fault. And it came up to the surface beneath the river and actually created a stair step in the river bottom to where it set up waves that went coursing back upstream,” says Susan Hough of the U.S. Geological Survey in Pasadena, Calif. She says much of what we know about those early quakes comes from firsthand accounts, like one from future president Zachary Taylor. He felt the shaking 230 miles away in Louisville.
Earthquakes can’t be predicted, but the probability of a major event along the New Madrid Fault is ever-present. Before you say, “It can’t happen here”, remember the August 2011 Earthquake at 5.8 on the Richter Scale. It resulted in between $200 and $300 million in damages, of which only $100 million was insured. The tremors reverberated 74 miles to Washington, DC, damaging the Washington Monument, the National Cathedral and more. And none of this mentions the damage anticipated when an earthquake disrupts the alignment path of microwave towers, severing all communications. Security risk? You bet!
Yet another vulnerability on the inland river system are the locks, and there are 240 of them.
The locks, as a whole, are in a sorry state of repair, with 50% having outlived their projected 50 year life-span. A lock failure can have escalating repercussions. A study by the Texas Transportation Institute determined that when a lock closes, transport costs escalate $1.50 per ton per lock. When Greenup (mile marker 341 on the Ohio) closed for 52 days, it cost $42 million, and that was with an operational auxiliary lock. When McAlpine (mile marker 606 on the Ohio) closed for 11 days, the cost was estimated at $6.3 million. On the Ohio, the time locks have been out of service to make emergency repairs has increased from 25,000 hours per year to 80,000 hours per year since 2000.
It matters not whether bridges collapse into the Mississippi River because of an earthquake or a terrorist attack, the long-term repercussions from blocking barge traffic on the River would be intense and catastrophic. A lock failure, blocking the river above it, can be equally catastrophic. Managing risk and recovering from incidents, regardless of causation is everyone’s responsibility. We need a systematic process to review the economic impact of events as part of ongoing operations. Trade associations should consider ways to improve reliability that enhance the industry’s competitive position in securing support (and funding).
Ports have been encouraged to develop Port-Wide Trade Resumption and Resiliency Plans to assist policy makers in assessing and adopting mitigation measures. The TRRP must be integrated into the existing emergency preparedness matrix and should reflect a regional approach to managing risks.The objective of the TRRP is to identify gaps and recommend mitigation measures intended to rapidly restore trade by adding resiliency in the systems that support port functions to minimize economic losses.