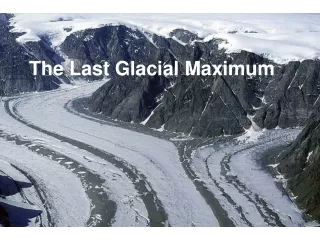
Last Glacial Maximum
Last Glacial Maximum. Chapter 12 Bao, Mario, Ariel, & Keiyro. 12-1 Project CLIMAP. CLIMAP (Climate Mapping and Predictions) Project began in early 1970s First map of ice-age Earth released 1976. 12-1 First CLIMAP Map. 12-1 Project CLIMAP. Major Ice Sheets…. -Laurentide ice sheet

Last Glacial Maximum
E N D
Presentation Transcript
Last Glacial Maximum Chapter 12 Bao, Mario, Ariel, & Keiyro
12-1 Project CLIMAP CLIMAP (Climate Mapping and Predictions) Project began in early 1970s First map of ice-age Earth released 1976
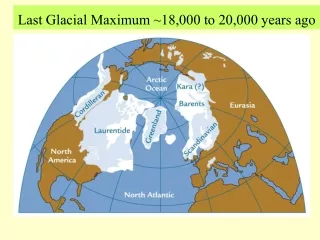
12-1 Project CLIMAP Major Ice Sheets…. -Laurentide ice sheet -Cordilleran ice sheet -Scandinavian ice sheet -Barents ice sheet
12-2 How Large Were the Ice Sheets? CLIMAP reconstruction highly controversial due to: 1. The extent that ice reached 2. Ice centered on marine ice sheets 3. Thickness and height of ice sheets
12-3 Glacial Dirt Glacial outwash: sediment deposits from glacial meltwater
12-3 Wind Wind reworks and carry deposits -Deposits can be worldwide -Na+ and Cl- ions (salt)
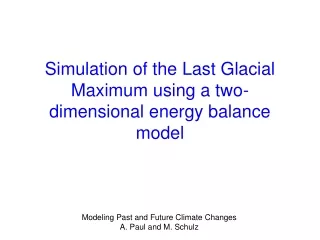
12-4 COHMAP COHMAP (Cooperative Holocene Mapping Project) began in 1980s Combined data-model approach to examine the last glacial maximum and subsequent changes to interglacial conditions.
12-4 COHMAP Approach 1. Assemble records of changing conditions that drive climate -Over last 21,000 years 2. Ran model simulations of climate 3. Climate data produced was tested against climate reconstructions
12-5 Pollen: A Climate Indicator Precipitation and temperature determine vegetation growth Pollen is carried by wind, water, insects -Settles into mud and preserved
12-5 Pollen in a Lake Core -Spruce pollen -Oak pollen -Prairie pollen
12-6 Biome Models A model that simulates the vegetation that can exist in a region
12-7 Glacial Ice Sheets Ice sheets affected atmospheric flow Massive, icy plateaus blocked/redirected the flow of air
12-8 Northern Ice Sheets Most dramatic climate changes experienced by regions closest to ice sheets
12-8 Changes in North America Lakes once occupied deserts in SW U.S Pacific NW was colder and drier Climate due to jet stream’s influence
12-8 Changes in Eurasia Climate was far harsher and colder Less trees and vegetation
12-8 Permafrost Permafrost: permanently frozen soil and rocks due to the cold Evidence of permafrost in Asia
12-9 Away from the Northern Sheets Climate changes less dramatic More affected by CO2 and methane gas
12-9 Glacial Tropics Oceans were 1°-2°C cooler -Based off plankton fossils Tropics too far away from ice sheets to be affected -What caused cooling in the tropics?
12-10 Small Tropical Cooling CLIMAP reconstruction based on planktic fauna/flora in oceans Evidence shows ocean temperatures cooled by an average of 1.5°C
12-10 Alkenones Alkenones: organic molecules in plant plankton shells Used in temperature reconstructions
12-11 Large Tropical Cooling The atmosphere cools 6.5°C for every kilometer 4°-6°C cooling shown from drop in ice line of tropical mountains
12-12 Tropical Cooling CLIMAP estimated tropical cooling to be small and Critics estimated tropical cooling to be large Which side was right?
12-12 Medium-Small Cooling Errors of CLIMAP -Dissolved CaCO3 samples -Latitude and Plankton adaptability
12-12 Medium-Small Cooling Discrepancies between land and ocean temperature changes -Lowering of sea level -Greater land response to climate forcing
12-12 Medium-Small Cooling Temperature drop estimated to be 3°C Models capture effects of greenhouse gases -Useful in forecasting future climate changes