Download
1 / 1
10 likes | 119 Views

E N D
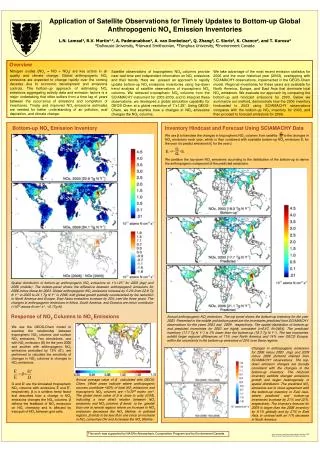
Nitrogen oxides (NOx = NO + NO2) are key actors in air quality and climate change. Global anthropogenic NOx emissions are expected to change rapidly over the coming decades due to economic development and emissions controls. The bottom-up approach of estimating NOx emissions aggregating activity data and emission factors is a major undertaking that often suffers from a time lag of years between the occurrence of emissions and completion of inventories. Timely and improved NOx emissions estimates are needed for better understanding of air pollution, acid deposition, and climate change. Satellite observations of tropospheric NO2 columns provide near-real-time and independent information on NOx emissions and their trends. Here we present an approach to rapidly update bottom-up NOx emissions inventories using top-down trend analysis of satellite observations of tropospheric NO2 columns. We retrieved tropospheric NO2 columns from the SCIAMACHY instrument for 2003-2009, and to interpret these observations, we developed a global simulation capability for GEOS-Chem at a global resolution of 1°x1.25°. Using GEOS-Chem, we first examine how a changes in NOx emissions changes the NO2 columns. We take advantage of the most recent emission statistics for 2006 and the most historical year (2003), overlapping with SCIAMACHY observations, implemented in the GEOS-Chem model. Regional inventories for these years are available for North America, Europe, and East Asia that dominate total NOx emissions. We evaluate our approach by comparing the bottom-up and hindcast emissions for 2003. Below we summarize our method, demonstrate how the 2006 inventory hindcasted to 2003 using SCIAMACHY observations compares with the bottom-up NOx inventory for 2003, and then proceed to forecast emissions for 2009. Inventory Hindcast and Forecast Using SCIAMACHY Data Bottom-up NOx Emission Inventory Spatial distribution of bottom-up anthropogenic NOx emissions at 1°x1.25° for 2003 (top) and 2006 (middle). The bottom-panel shows the difference between anthropogenic emissions for 2006 minus those for 2003. Global anthropogenic NOx emissions increase by 5.2% from 22.9 Tg N Y-1 in 2003 to 24.1 Tg N Y-1 in 2006, with global growth partially counteracted by the reduction in North America and Europe. East Asian emissions increase by 25% over the three years. The changes in anthropogenic emissions in Africa, South America, and Oceania are minor contributor (<1010 atoms N cm-2 s-1, <0.1Tg N). Annual anthropogenic NOx emissions. The top panel shows the bottom-up inventory for the year 2003. Presented in the middle and bottom panel are the inventories predicted from SCIAMACHY observations for the years 2003 and 2009 , respectively. The spatial distribution of bottom-up and predicted inventories for 2003 are highly consistent (r=0.87, N=2464). The predicted inventory (17.7 Tg N Y-1) is 3% lower than the bottom-up (18.3 Tg N Y-1). The two inventories exhibit larger regional differences of 11% over North America and 14% over OECD Europe, within the uncertainty in the bottom-up emissions of 25% over these regions. Application of Satellite Observations for Timely Updates to Bottom-up Global Anthropogenic NOx Emission Inventories L.N. Lamsal1, R.V. Martin1,2, A. Padmanabhan1, A. van Donkelaar1, Q. Zhang3, C. Sioris4, K. Chance2, and T. Kurosu2 1Dalhousie University, 2Harvard Smithsonian, 3Tsinghua University, 4Environment Canada Overview We use β to translate the changes in tropospheric NO2 columns from satellite to the changes in NOx emissions each year, which is then combined with available bottom-up NOx emissions Ei for the year i to predict emissions Ej for the year j: We partition the top-down NOx emissions according to the distribution of the bottom-up to derive the anthropogenic component of the predicted emissions. Response of NO2 Columns to NOx Emissions We use the GEOS-Chem model to examine the relationship between tropospheric NO2 columns and surface NOx emissions. Two simulations, one with NOx emissions (E) for the year 2006 and another with anthropogenic NOx emissions perturbed by 15% (E’), are performed to calculate the sensitivity of changes in NO2 columns to changes in NOx emissions: Ω and Ω’ are the simulated tropospheric NO2 columns with emissions E and E’, respectively. β is a unitless trend factor that describes how a change in NOx emissions changes the NO2 columns. β reflects the feedback of NOx emissions on NOx chemistry and is affected by transport of NOx between grid cells. Changes in anthropogenic emissions for 2006 minus 2003 (top) and 2009 minus 2006 (bottom) inferred from SCIAMACHY observations. The top-down emission changes are broadly consistent with the changes in the bottom-up inventory. The hindcast inventory exhibits stronger emissions growth and larger heterogeneity in spatial distribution. The predicted NOx emissions are in close agreement with the bottom-up inventory in East Asia, where predicted and bottom-up inventories increase by 21% and 22%, respectively. The inventory forecast for 2009 is larger than the 2006 inventory by 9.1% globally and by 21% in East Asia, in contrast with an 11% decrease in North America. Annual average value of β calculated with GEOS-Chem. White areas indicate where anthropogenic sources contribute <50% of total NOx emissions and tropospheric NO2 columns are <1x10¹⁵ molec cm-2. The global mean value of βis close to unity (0.99), indicating a near direct relation between NOx emissions and NO2 columns. β tends to be greater than one in remote regions where an increase in NOx emissions decreases the NOx lifetime. In polluted regions, β tends to be less than one since an increase in NOx consumes OH and increases the NOx lifetime. This work was supported by NASA’s Atmospheric Composition Program and by Environment Canada. igac_inventory_prediction_potrait.ppt presented at 2010 IGAC-ICACGP Joint Conference, Halifax, Canada.