Download
1 / 33
330 likes | 474 Views
Empirical Analysis of Traffic Sensor Data Surrounding a Bottleneck on a German Autobahn. Robert L. Bertini Steven Hansen Portland State University Klaus Bogenberger BMW Group TRB Annual Meeting January 10, 2005. Introduction. Objectives.

E N D
Empirical Analysis of Traffic Sensor Data Surrounding a Bottleneck on a German Autobahn. Robert L. Bertini Steven Hansen Portland State University Klaus Bogenberger BMW Group TRB Annual Meeting January 10, 2005
Introduction.Objectives. • Empirical analysis of features of traffic dynamics and driver behavior on a German autobahn. • Understand details of bottleneck formation and dissipation. • Improved travel time estimation and forecasting: • Traffic management • Traveler information • Driver assistance systems. • Contribute to improved traffic flow models and freeway operational strategies.
Background. • Previous empirical research (U.S., Canada, Germany) • Active bottleneck definition: • Queue upstream • Unrestricted traffic downstream • Temporally and spatially variable, static and dynamic, merges and diverges. • Activation/deactivation times. • Bottleneck outflow features and possible triggers. • Opportunity to compare with previous findings using data from German freeways.
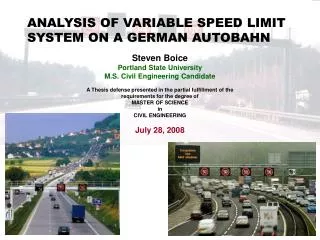
Study Area.Data. • 14-km section of northbound A9, Munich • 17 dual loop detector stations (labeled 280–630) • One-minute counts & average speeds • Cars • Trucks • Six days in June–July 2002 • Focus on June 27, 2002 • Clear weather • Variable speed limits and traffic information (VMS) 630
Methodology.Analysis Tools. • Cumulative curves (Newell, Cassidy & Windover): • Vehicle count • Average speed • Transformations to heighten visual resolution: • Oblique axis • Horizontal shift with vehicle conservation • Retain lowest level of resolution (one-minute) • Identify bottleneck activations and deactivations.
Bottleneck Activation June 27, 2002Station 380 420 450 390 380off 350 Station 380 + Off Ramp 250 N(x,t)-q0t′,q0=5170 veh/hr 150 50 Time -50 630 14:45 14:50 14:55 15:00 15:05 15:10 15:15 15:20 15:25 15:30 15:35 15:40 15:45 15:50
Bottleneck Activation June 27, 2002Stations 380–390–420 Station 420 + On Ramp Station 390 Station 380 + Off Ramp N(x,t)-q0t′,q0=5170 veh/hr Time 630
Bottleneck Activation June 27, 2002Stations 380–390–420 15:21@ Station 390 15:21@ Station 380 Flow Reduction @380 N(x,t)-q0t′,q0=5170 veh/hr Time 630
380 70 km/h 15:21 89 km/h V(380,t)-b0t′,b0=3300 km/hr2 Time 15:15 15:20 15:25 15:30 Bottleneck Activation June 27, 2002Station 380 Speed 630
Bottleneck Activation June 27, 2002Stations 380–390–420 15:24@ Station 420 15:21@ Station 390 15:21@ Station 380 380 55600 70 89 15:21 V(380,t)-b0t′,b0=3300 km/hr2 55400 Flow Reduction @380 N(x,t)-q0t′,q0=5170 veh/hr Time 55200 15:15 15:20 15:25 15:30 390 98220 80 41 V(390,t)-b0t′,b0=4335 km/hr2 98170 15:21 98120 Time 15:15 15:20 15:25 15:30 420 95110 65 92 V(420,t)-b0t′,b0=4850 km/hr2 95060 15:24 Time 95010 Time 15:15 15:20 15:25 15:30 630
540 29800 39 V(540,t)-b0t′,b0=4550 km/hr2 97 29600 15:34 Time 29400 15:15 15:20 15:25 15:30 15:35 15:40 15:45 560 43 83 36620 V(560,t)-b0t′,b0=3550 km/hr2 15:41 36520 Time 36420 15:30 15:35 15:40 15:45 15:50 15:55 16:00 580 34480 43 87 34380 V(580,t)-b0t′,b0=3650 km/hr2 15:42 34280 Time 34180 15:30 15:35 15:40 15:45 15:50 15:55 16:00 600 32700 38 72 32600 V(600,t)-b0t′,b0=3450 km/hr2 15:47 32500 Time 32400 15:30 15:35 15:40 15:45 15:50 15:55 16:00 630 41850 20 93 15:58 V(630,t)-b0t′,b0=3100 km/hr2 41650 Time 41450 15:45 15:50 15:55 16:00 16:05 16:10 16:15 Bottleneck Activation June 27, 2002 630
540 29800 39 V(540,t)-b0t′,b0=4550 km/hr2 97 29600 15:34 Time 29400 15:15 15:20 15:25 15:30 15:35 15:40 15:45 560 43 83 36620 V(560,t)-b0t′,b0=3550 km/hr2 15:41 36520 Time 36420 15:30 15:35 15:40 15:45 15:50 15:55 16:00 580 34480 43 87 34380 V(580,t)-b0t′,b0=3650 km/hr2 15:42 34280 Time 34180 15:30 15:35 15:40 15:45 15:50 15:55 16:00 600 32700 38 72 32600 V(600,t)-b0t′,b0=3450 km/hr2 15:47 32500 Time 32400 15:30 15:35 15:40 15:45 15:50 15:55 16:00 630 41850 20 93 15:58 V(630,t)-b0t′,b0=3100 km/hr2 41650 Time 41450 15:45 15:50 15:55 16:00 16:05 16:10 16:15 Bottleneck Activation June 27, 2002 1 15:21 15:24 15:34 15:41 15:42 15:47 15:58 630
Bottleneck Activation June 27, 2002Stations 320–340–350–380 N(x,t)-q0t′,q0=5170 veh/hr Station 380 + On-Ramp Station 350 Station 340 Station 320 + Off-Ramp Time 630 Time @ station 380
Bottleneck Activation June 27, 2002Stations 320–340–350–380 N(x,t)-q0t′,q0=5170 veh/hr 15:21@ Station 380 Flow Reduction @380 Time 630 Time @ station 380
320 104 15:27 19790 105 V(320,t)-b0t′,b0=6000 km/hr2 19740 Time 19690 15:15 15:20 15:25 15:30 15:35 15:40 15:45 340 15:26 97 22420 V(340,t)-b0t′,b0=5600 km/hr2 99 22370 Time 22320 15:15 15:20 15:25 15:30 15:35 15:40 15:45 350 15:23 84 40700 84 V(350,t)-b0t′,b0=4200 km/hr2 40600 40500 Time 15:15 15:20 15:25 15:30 Bottleneck Activation June 27, 2002Stations 320–340–350–380 N(x,t)-q0t′,q0=5170 veh/hr 15:21@ Station 380 15:23@ Station 350 Flow Reduction @380 15:27@ Station 320 15:26@ Station 340 Time 630 Time @ station 380
Bottleneck Activation June 27, 2002 • Active bottleneck located between detectors 380 and 390. • Activated at 15:21. • Queue propagated as far as detector 630. • Unrestricted traffic downstream. 630
Bottleneck ActivationJune 27, 2002 17:28 1 17:35 19:40 15:21 17:38 18:44 19:18 15:24 17:40 15:34 15:41 15:42 15:47 15:58 630 Direction of Travel
Bottleneck ActivationJune 27, 2002 2 17:28 1 17:35 19:40 15:21 17:38 18:44 19:18 15:24 17:40 15:34 15:41 15:42 15:47 15:58 630 Direction of Travel
Bottleneck ActivationJune 27, 2002 2 17:28 1 17:35 3 19:40 15:21 17:38 18:44 19:18 15:24 17:40 15:34 15:41 15:42 15:47 15:58 630 Direction of Travel
Bottleneck ActivationJune 27, 2002 2 17:28 4 1 17:35 3 19:40 15:21 17:38 18:44 19:18 15:24 17:40 15:34 15:41 15:42 15:47 15:58 630 Direction of Travel
Bottleneck Activation June 27, 2002Stations 380–390–420 N(x,t)-q0t, q0=5178 veh/hr N(420,t) N(390,t) 100 N(380,t) 0 Time 15:00 16:00 17:00 18:00 19:00 630
Bottleneck Activation June 27, 2002 1 N(x,t)-q0t, q0=5178 veh/hr N(420,t) N(390,t) 100 N(380,t) 0 18:45 19:18 17:35 17:40 15:21 Time 15:00 16:00 17:00 18:00 19:00 630
Bottleneck Activation June 27, 2002 1 N(x,t)-q0t, q0=5178 veh/hr 100 N(380,t) 0 18:45 19:18 17:35 17:40 15:21 Time 15:00 16:00 17:00 18:00 19:00 630
Bottleneck Activation June 27, 2002 1 5370 vph N(x,t)-q0t, q0=5178 veh/hr 100 N(380,t) 0 18:45 19:18 17:35 17:40 15:21 5510 vph Time 15:00 16:00 17:00 18:00 19:00 630
Bottleneck Activation June 27, 2002 4 1 5370 vph N(x,t)-q0t, q0=5178 veh/hr 100 N(380,t) 0 18:45 19:18 17:35 17:40 15:21 5510 vph 5410 vph Time 15:00 16:00 17:00 18:00 19:00 630
Bottleneck Activation Northbound A9Outflow Summary at 380 630
Bottleneck Activation Northbound A9On-Ramp DynamicsJune 27, 2002 Station 420 600 15:21 @390 500 2630 t' 15:20 400 0 2330 15:16 1850 300 N(420 on ramp,t) - q 2660 (+12%) 2370 1830 200 2630 100 2280 veh/hour Time 0 14:30 14:45 15:00 15:15 15:30 15:45 16:00 630
Bottleneck Activation Northbound A9Station 420 Truck Flow Dynamics June 27, 2002 Ramp Right q0=385 veh/hour 15:21 @390 Trucks Only 510 330 490 260 750 (+190%) 530 Mainline Right q0=220 veh/hour N(x,t)-q0t 320 230 580 Ramp Left q0=15 veh/hour 160 50 550 320 350 (+120%) 330 240 400 veh/hour 170 100 390 50 40 24 230 30 Mainline Left q0=22 veh/hour 20 630 270 (9 trucks in 2 minutes)
Bottleneck 1 Activation Northbound A9Station 390 Truck Flow Dynamics June 27, 2002 Shoulder q0=560 veh/hour 15:21 @390 Trucks Only 740 570 420 820 (+95%) 770 Center q0=65 veh/hour 180 670 80 470 140 740 N(x,t)-q0t 400 630 veh/hour 100 210 (+120%) 210 80 20 30 Median q0=15 veh/hour 200 220 70 20 70 180 (6 trucks in 2 minutes, +680%) 20 630
Conclusion. • Method for diagnosing active bottlenecks. • 11 bottleneck activations on 6 days at one location. • Measured bottleneck outflows appear stable: • Day to day (contrary to other research) • Preceded by queueing or not • Pre-queue flows measurably higher than bottleneck outflow. • Precursors to queue formation some distance downstream of merge: • Rise in on-ramp flow (total) • Surges in truck counts • Research continuing at this and other sites in Germany.
Thank you for your attention. AcknowledgementsBMW GroupOregon Engineering Technology Industry CouncilPortland State UniversitySteven Boice