Region 4 ESC Accountability Update
650 likes | 817 Views
Region 4 ESC Accountability Update. Richard Blair Sr. Education Specialist Federal/State Accountability. Accountability: Current Issues Thursday, April 10, 2014. Current Issues. 2013. 2014. 4 Index System Most ELL Students INCLUDED Gr. 3-8 Tests 5 EOC Tests No Index 2 Score

Region 4 ESC Accountability Update
E N D
Presentation Transcript
Region 4 ESCAccountability Update Richard Blair Sr. Education Specialist Federal/State Accountability Accountability: Current Issues Thursday, April 10, 2014
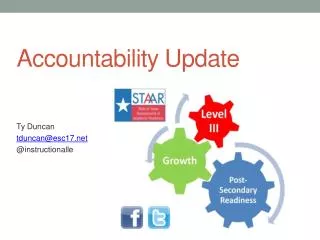
Current Issues 2013 2014 4 Index System Most ELL Students INCLUDED Gr. 3-8 Tests 5 EOC Tests No Index 2 Score HS Campses AEA Campuses Continue Phase I • 4 Index System • Most ELL Students EXCLUDED • First Year of System • 3-8 Tests • 15 EOC Tests • Index 2 for All • Index 4 for HS Only • Phase I
2014 State of Texas Accountability System ELL Inclusion
Index 1 – Student Achievement • Provide an overview of student performance based on satisfactory student achievement across all subjects for all students. • Summed across tests, grades, subjects.
Index 1 – Student Achievement • All Students Group Only • Students counted once per subject • Absolute Target • 2013: 50 • 2014: 55 • Increase based on Continuation of Phase I Standards
Index 2 – Student Growth • All Students, All Race/Ethnicity, ELL, SWD • STAAR Progress Measure • ELL Progress Measure • 2+ Years in US Schools • No ELL Progress Measure • Spanish 2013 to English 2014 in Reading
Index 2 – Student Growth (cont.) • No Index 2 • High Schools • Resume for 2015 Accountability • Not enough tests (Algebra I, EOC English I, II Alternate • AEA Campuses • Same as High School • 5% Threshold for Not Meeting Index Standard (by School/Dist. Type)
Index 3 – Closing the Gaps • Economically Disadvantaged and up to 2 LOWEST Performing Race/Ethnicity Groups • Two Indicators • Phase I, Level II • Level III Advanced • Minimum Size • Eco. Dis. – None • Others – 25 tests in Reading AND Math
Index 4 – Postsecondary Readiness • New Indicators • First Year for Elementary and Middle • Changes for High Schools/Districts • Change from Level III to Final Level II Standard
Index 4 – Postsecondary Readiness (cont.) • Four Components or One Component • Elem/Ms: One Component • STAAR Final Level II – 100% • High School: Four Components • STAAR Final Level II – 25% • Graduation Rate – 25% • Graduation Plan – 25% • Post Secondary Indicator – 25% • Additional coming for 2015
Index 4 – Postsecondary Readiness (cont.) • STAAR Component Targets: • Elementary Schools – 12 • Middle Schools – 13 • High Schools – 18 • Districts – 13 • Index Targets: • ES, MS Same as STAAR Component Target • HS and Districts = 56
2014 State of Texas Accountability System Alternative Education
AEA Campus/District • Index 1 – 30 • Index 2 – Lowest 5% • Index 3 – Lowest 5% • Index 4 – 35 • 75% Graduation Rate, 25% STAAR • Middle Schools ??? • Graduation Rate • Includes Continuers, GED
2014 State of Texas Accountability System Other Items of Interest
Additional Issues • Additional Distinction Designations • Postsecondary Readiness - District • Target of 70% of all Postsecondary Indicators which are in the Top Quartile (25%) across campuses. • Science and Social Studies Indicators • Closing Achievement Gap • Top Quartile (25%)
Additional Issues (cont.) • ELL Progress for Spanish to English • Phase I, Level II = Exceeds • Below Phase I, Level II = Did Not Meet • Credit for EOC Substitute Assessments • Use in Index 1 and 4 only • In TEA Rules • EOC English I and English II • Combined Test in Spring AND • EOC Eng I, II Reading Tests from Fall, Summer
Commissioner Michael Williams posted his final decisions regarding the new state accountability system April 4, 2014.
Hot Topic The 2014 Updated State Accountability System
2014 Accountability Target: 55 Index 1: Student Achievement Index 1: Student Achievement provides an overview of student performance based on satisfactory student achievement across all subjects for all students. Subjects: Combined over Reading, Mathematics, Writing, Science, and Social Studies. Student Groups: All Students only
2013 Accountability Target: 55 Index 1: Student Achievement Index 1: Student Achievement provides an overview of student performance based on satisfactory student achievement across all subjects for all students. Performance Standards: Phase-in I Level II Standard (Satisfactory) STAAR Grades 3-8 English and Spanish (3-5) assessments for Spring 2014 EOC assessments (best result: highest score) spring 2014, fall 2013 and summer 2013 STAAR Grades 3-8 and EOC Modified for Spring 2014 STAAR Grades 3-8 and EOC Alternate for Spring 2014 TAKS Not Included in 2014 and BEYOND
2014 Accountability Target: 55 Index 1: Student Achievement Index 1 Student Achievement provides an overview of student performance based on satisfactory student achievement across all subjects for all students. Accountability subset: Grades 3-8 – fall enrollment snapshot date EOC – for tests administered in spring and fall, fall enrollment snapshot date; for tests administered in summer, prior year fall enrollment snapshot date
2014 Accountability Target: 55 Index 1: Student Achievement Index 1 Student Achievement provides an overview of student performance based on satisfactory student achievement across all subjects for all students. Minimum size criteria None Small numbers analysis for fewer than 10 Retest results: 5 and 8: best result from primary administration and first retest EOC: best results from 1st administration and retest results of test administered in the current accountability year (spring 2013, fall 2012 and summer 2012)
Index 1: Student Achievement • Look for the best score for Summer 12, Fall 12 and Spring 13 • Attribute the result to the appropriate campus • Example 1: A middle school student tested in spring 12 and failed, after accelerated instruction the student retested and passed summer of 2012 • Pass attributed to middle school campus Student must be in accountability subset! For students who are enrolled and testing on the same campus or district during 2013 accountability cycle, the system will include EOC results based upon the best result from the first administration and retest results of tests administered in Summer 12, Fall 12 and Spring 13. This could include results for students who took an EOC test in a prior accountability cycle. For example, the summer 12 retest results include students who were first tested in spring 12.
Index 1: Student Achievement • Look for the best score for Summer 12, Fall 12 and Spring 13 • Attribute the result to the appropriate campus • Example: A middle school student tested Algebra I in spring 12 and failed, after accelerated instruction the student retested and failed summer of 2012. Received additional support at the high school campus retested and failed Fall of 12, but passed Spring 2013. • Pass attributed to high school campus, but summer 12 fail not attributed to middle school. Let’s talk about mobility….. What about EOC results where primary administration was the in the prior accountability year? Student must be in accountability subset!
Index 1: Student Achievement • Look for the best score for Summer 12, Fall 12 and Spring 13 • Attribute the result to the appropriate campus • Example: A middle school student tested Algebra I in spring 12 and failed. After additional instruction the student retested and barely passed summer of 2012. He or she received additional support at the high school campus, retested and passed Fall of 12 (best score), but again retested and passed Spring 2013. • Pass attributed to high school campus for Fall of 2012, since this was the student’s best score. • The test result Summer 12 (pass) was not attributed to the middle school campus. Let’s talk about mobility….. What about EOC results where primary administration was the in the prior accountability year? Student must be in accountability subset!
Index 1: Student Achievement • Look for the best score for Summer 12, Fall 12 and Spring 13 • Attribute the result to the appropriate campus • Example: A middle school student tested in spring 12 and failed, after accelerated instruction the student retested and failed summer of 2012. Received additional support at the high school retested but failed fall 2012 and failed spring 2013 • Fail attributed to high school campus because the failure is attributed to the last place where the student attended and tested. • The test result (fail) from summer 12 is not attributed to the middle school campus. When all test results do not meet the passing standard, then the most recent test is chosen. Student must be in accountability subset!
Index 1: Student Achievement What does this mean….. A student could count over more than one accountability year. Sara Beth a Top o Texas ISD student, took and failed Algebra I at Top-o-Texas Middle School in the spring of 2013. Was advanced to Top-o-Texas High School, where she received accelerated instruction in the fall of 2013. The spring 2013 failure is attributed to the middle school campus. Sara Beth then took the fall 2013 administration of Algebra I and failed. She continued to receive additional supports from the Top-o-Texas High School, but although her sc0re improved, she failed the spring 2014 Algebra I administration. The last failure is attributed to the high school campus for 2014. So Sara Beth’s Algebra I EOC scores count in both 2013 and 2014!
2014 Accountability Target: 55 Index 1: Student Achievement Index 1: Student Achievement provides an overview of student performance based on satisfactory student achievement across all subjects for all students. English Language Learner Results (2013) Students in US schools year 1-3 Excluded Students in US schools Year 4 and beyond included at phase-in Level II performance standard Exceptions: Asylees/refugees in US schools year 1-Excluded Immigrants entering at Grade 9 or above - Excluded English Language Learner Results 2014 and beyond: Students in U.S. schools Year 1 excluded Students in U.S. schools Year 2 through Year 4 included based on test version: English test version using STAAR ELL Progress Measure; Spanish test version using phase-in Level II performance standard Students in U.S. schools Year 5 and beyond included at phase-in Level II performance standard Exceptions: asylees/refugees in U.S. schools Year 1 through Year 5 excluded; immigrants entering at Grade 9 or above excluded
2014 Accountability Target: at or about the 5 percentile Index 2: Student Progress Index 2: Student Progress focuses on actual student growth independent of overall achievement levels for each race/ethnicity student group, students with disabilities, and English language learners. • By Subject Area: Reading, Mathematics, and Writing for available grades. • Three Growth Standards (based upon a change in scale score): • Did Not Meet • Met • Exceeded • Credit based on weighted performance: • One point credit given for each percentage of tests at the Met growth expectations level. • Two point credit given for each percentage of tests at the Exceeded growth expectations level.
Index 2: Student Progress Index 2: Student Progress focuses on actual student growth independent of overall achievement levels for each race/ethnicity student group, students with disabilities, and English language learners. • Accountability subset: • Same as Index 1 beginning in grade 4 • Student groups: • All Students, ELL student group, special education student group, and seven race/ethnicity student groups: African American, American Indian, Asian, Hispanic, Pacific Islander, White, Two or More Races
Index 2: Student Progress Index 2: Student Progress focuses on actual student growth independent of overall achievement levels for each race/ethnicity student group, students with disabilities, and English language learners. • Minimum size criteria: • All Students – • 2014 and beyond: None, small numbers analysis if fewer than 10 • Race/ethnicity, English language learner and special education student groups >= 25
Index 2: Student Progress Index 2: Student Progress focuses on actual student growth independent of overall achievement levels for each race/ethnicity student group, students with disabilities, and English language learners. • ELL Results: • English test version results • 2013: excluded (STAAR ELL Progress Measure not available; STAAR growth measure not calculated for current ELLs tested on English test versions) • 2014: • Students in US schools Year I Excluded • Students in US Schools Year 2 and beyond: Included using STAAR Progress Measure • Exception: Spanish to English Reading Testers • Exceptions: Asylees/Refugees in US schools Year 1 through 5 excluded
2013 Accountability Target: at or about the 5 percentile Index 2: Student Progress Index 2: Student Progress focuses on actual student growth independent of overall achievement levels for each race/ethnicity student group, students with disabilities, and English language learners. • ELL Results: • Spanish test version results (STAAR growth measure calculated for current ELLs tested on Spanish test versions) • 2013: • Students in U.S. schools Year 1 through Year 3 excluded • Students in U.S. schools Year 4 and beyond included using STAAR growth measure • Exception: asylees/refugees in U.S. schools Year 1 through Year 5 excluded • Proposed 2014 and beyond: • Students in U.S. schools Year 1 excluded • Students in U.S. schools Year 2 and beyond included using STAAR growth measure • Exception: asylees/refugees in U.S. schools Year 1 through Year 5 excluded
2014 Accountability Target: 5 %tile Index 3: Closing Performance Gaps • Student Groups • Socioeconomic: Economically Disadvantaged • Lowest Performing Race/Ethnicity: The two lowest performing race/ethnicity student groups on the campus or district (based on prior-year assessment results). • Three or more race/ethnicity student groups that meet minimum size criteria: • the performance of the two lowest performing race/ethnicity groups are included in the index. • Two or more race/ethnicity student groups that meet minimum size criteria: • The performance of the lowest performing race/ethnicity group is included in the index. • Only one race/ethnicity student group that meets the minimum size criteria: • the race/ethnicity group is not included in the index. • Lowest performing groups are determined by comparing performance of race/ethnicity groups on the Index 1 student achievement indicator of the prior year.