Download
1 / 18
180 likes | 301 Views
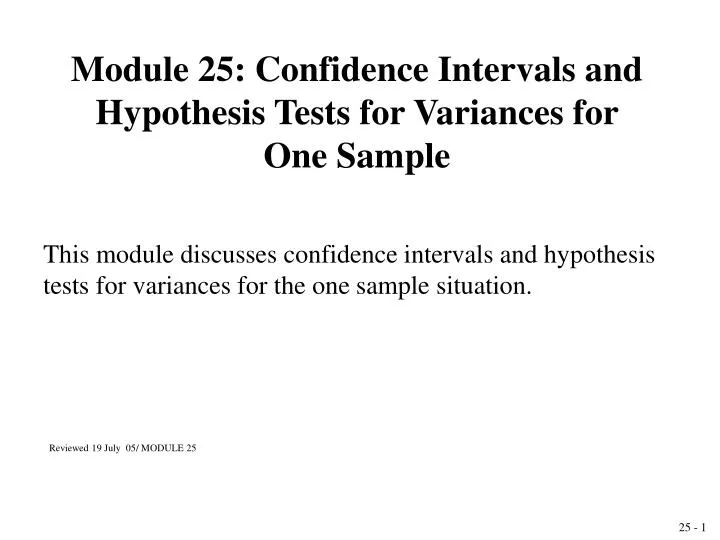
Module 25: Confidence Intervals and Hypothesis Tests for Variances for One Sample. This module discusses confidence intervals and hypothesis tests for variances for the one sample situation. Reviewed 19 July 05/ MODULE 25. The Situation.

E N D
Module 25:Confidence Intervals and Hypothesis Tests for Variances for One Sample This module discusses confidence intervals and hypothesis tests for variances for the one sample situation. Reviewed 19 July 05/ MODULE 25
The Situation Earlier we selected from the population of weights numerous samples of sizes n = 5, 10, and 20 where we assumed we knew that the population parameters were: = 150 lbs, 2 = 100 lbs2, = 10 lbs.
For the population mean , point estimates, confidence intervals and hypothesis tests were based on the sample mean and the normal or t distributions. For the population variance 2, point estimates, confidence intervals and hypothesis tests are based on the sample variance s2 and the chi-squared distribution for
For a 95% confidence interval, or = 0.05, we use For hypothesis tests we calculate and compare the results to the χ2 tables.
Population of Weights Example n = 5, = 153.0, s = 12.9, s2 = 166.41 s2 = 166.41 is sample estimate of 2 = 100 s = 12.9 is sample estimate of = 10 For a 95% confidence interval, we use df = n - 1 = 4
Other Samples From the Population of weights, for n = 5, we had s2 = 5.4 s3 = 18.6 s4 = 8.1 s5 = 7.7
95% CI for 2, n = 5, df = 4 Length = 230.52 lbs2 Length = 2,734.98 lbs2
Length = 518.68 lbs2 Length = 468.72 lbs2
For n = 20, we had s1 = 10.2 s2 = 8.4 s3 = 11.4 s4 = 11.5 s5 = 8.4
95% CIs for 2, n = 20, df = 19 Length = 161.76 lbs2
Example: For the first sample from the samples with n = 5, we had s2 = 166.41. Test whether or not 2 = 200. 1. The hypothesis: H0: 2 = 200, vs H1: 2 ≠ 200 2. The assumptions: Independent observations normal distribution 3. The α-level: α = 0.05
4. The test statistic: 5. The critical region:Reject H0: σ2 = 200 if the value calculated for χ2 is not between χ20.025 (4) =0 .484, and χ20.975 (4) =11.143 6. The Result: 7. The conclusion: Accept H0: 2 = 200.
The Question Table 3 indicates that the mean Global Stress Index for Lesbians is 16 with SD = 6.8. Suppose that previous work in this area had indicated that the SD for the population was about = 10. Hence, we would be interested in testing whether or not 2 = 100.
1. The hypothesis: H0: 2 = 100, vs H1: 2 ≠ 100 • The assumptions: Independence, normal distribution 3. The α-level: α = 0.05 • The test statistic: • 5. The critical region:Reject H0: σ2 = 100 if the value • calculated for χ2 is not between • χ20.025 (549) = 615.82, and • χ20.975 (549) = 485.97 • The Result: • 7. The conclusion: Reject H0: 2 = 100.