Download

1 / 30
300 likes | 408 Views
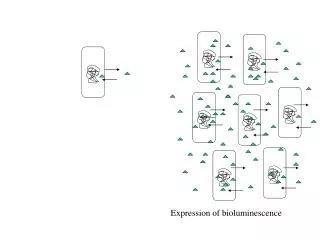
Assessment of ATP Bioluminescence monitoring in restaurants. Paul B. Allwood, PhD, MPH, RS Minnesota Department of Health St. Paul, Minnesota. How fireflies produce light. Luciferase/luciferin Oxygen ATP. Adenosine Triphosphate (ATP). Light proportional to ATP.

E N D
Assessment of ATP Bioluminescence monitoring in restaurants Paul B. Allwood, PhD, MPH, RS Minnesota Department of Health St. Paul, Minnesota
How fireflies produce light • Luciferase/luciferin • Oxygen • ATP
ATP Bioluminescence test kits • Collection • Single use swabs (cotton or foam) • ATP releasing agent • ATP detection/quantification • Self-contained enzyme and co-factor • Luminometer • Data handling
Concept • Clean food contact surfaces • Little or no ATP • Easier to sanitize • Decreased microbial risk • Unclean food contact surfaces • High levels of ATP • Harder to sanitize • Significant microbial risk
Cleaning standards for food contact surfaces (FCS) • Goal • Remove organic matter • FCS for PHF/TCS • As often as necessary • Once every four hours • Related to temperature • Clean to sight and touch
Food Contact Surface (FCS) • A surface of EQUIPMENT or a UTENSIL with which FOOD normally comes into contact; or (2) A surface of EQUIPMENT or a UTENSIL from which FOOD may drain, drip, or splash: (a) Into a FOOD, or (b) Onto a surface normally in contact with FOOD. 2005 FDA Model Food Code
Transient microbes on FCS • From raw materials • Humans • No history of establishment • Controlled by routine cleaning and sanitizing • E.g. Shigella and Campylobacter
MDH study • Pilot study to: • Assess utility of ATP testing • Determine failure rates of visibly clean FCS • Assess effect on failure of: • Menu • Method of warewashing • Type of equipment/utensils
Method • Samples collected in selected restaurants • Based on menu • Willingness to participate • Clean equipment and utensils sampled • Manufacturers instructions • Initial field trial • Zig-zag swabbing (east/west and north/south)
Pass/fail • Hygiena instructions • ≤ 30 RLUs (clean) • >30 and ≤ 300 RLUs (caution) • >300 RLU (unclean) • MDH study • ≤ 30 RLUs (pass) • > 30 RLUs (fail)
Data analysis • Summary statistics calculated for RLUs • Pass/fail frequencies calculated • Chi square significance • Data analyzed with: • version 3.3.2 EpiInfo software • SAS Enterprise Guide 3
Results summary • 137 out of 493 (28%) FCS failed • Failure rates varied with surface • Menu associated with failure • Warewashing associated with failure • Cutting boards and slicers worst • Cups and plates were best
ATP results by menu Chi-square 7.32; p-value 0.03
Manual High Temperature Low temp Failure rates by warewashing method 33% 46% 21% Chi-square 22.7; p-value < 0.0001
Mean RLU levels by FCS type 30 RLU
Discussion • Monitoring FCS cleaning is beneficial • Assess food contamination risk • Identify problems with cleaning protocols • Training • Cutting boards and slicers • Inadequate cleaning effort • Too hard to clean
Limitations/challenges • Only one system tested • Lack of background information • Lack of standard plans for sampling • ATP signal decay • Pass/caution/fail criteria
ATP monitoring of FCS cleaning • Why • Detect cleaning failure • Focus cleaning/training efforts • Where • Sites with direct contact with RTE foods • Sites most likely to reflect cleaning failures • How often • Based on knowledge of the operation • Economics
Acknowledgements • MDH staff • Gary Edwards • Pam Steinbach • Steven Diaz • University of Minnesota • Dr. Daniel Dodor