Community Ecology
Community Ecology. Definitions: A community is a group of species populations that occur together in the same place and the same time. Community ecology studies the patterns of species distributions and abundance, rules of species assembly, dynamics and stability.

Community Ecology
E N D
Presentation Transcript
Community Ecology Definitions: A community is a group of species populations that occur together in the same place and the same time. Community ecology studies the patterns of species distributions and abundance, rules of species assembly, dynamics and stability.
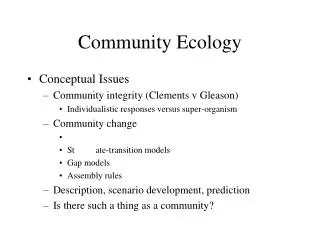
The Topics of Community Ecology Succession: how does open habitat become populated by first few than many species? Assemblage: Are there any rules that determine which species live together? Coexistence: how do many species requiring essentially the same habitats and resources coexist? Food webs: what are the feeding relationships between many members of a community?
Food chains and webs - the pathway of food and energy transfer through the organisms of a community -
Simplified food web for the Northwest Atlantic
Definition: Trophic Level Organisms can be categorized by how many levels they are removed from eating primary producers- plants. An organism’s trophic level is its “distance” from the primary producers at level 1. 1st : primary producers 2nd : primary consumers (vegetarians) 3rd : secondary consumers (carnivores I) 4th : tertiary consumers (carnivores II)
Lottia strigatella Lottia digitalis Lottia pelta mussels barnacles algae gulls oystercatchers Wootton 1992. (Tatoosh Island, Washington)
birds present birds excluded (Townsend, Begon and Harper 2003)
Effect of bird removal: Lottia strigatella Lottia digitalis Lottia pelta mussels barnacles + + release from predation release from predation - increased competition + - - + increase in safer habitat decrease in safer habitat increased competition increased competition Wootton 1992. (Tatoosh Island, Washington)
Complex food webs contain complex indirect interactions: • Enemies of your friends are your enemies (reduced predation of a mutualist can lead to increases in abundance). • Enemies of your enemies are your friends (reduced predation of a competitor can lead to decreases in abundance). • Sometimes, indirect effects are stronger than direct effects. • Sometimes, indirect and direct effects cancel one another. • The presence or absence of top predators often fundamentally changes community structure.
What controls the herbivores in food webs? Bottom-up control: Primary production sets a limit on herbivore density. (in low-productivity environments) To-down control: Carnivores control herbivore density which in turn control the density of primary producers. (in high-productivity environments)
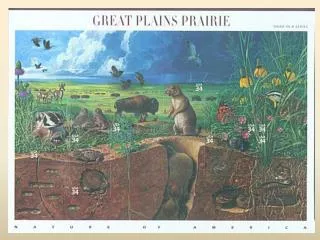
In the construction of arches, the keystone holds all other stones in place. Keystone species: a species whose removal would have significant effects on community structure and/or diversity. • Some recognized keystone species: • Black-tailed prairie dogs to the prairie community • Salmon to Canada’s coastal rainforests • Sea otters to Pacific coastal waters
Most food chains have 4 trophic levels or less. Schoener 1989
Why are so many food chains short? • Food chains run out of energy to support viable population sizes at higher trophic levels. • Long food chains are unstable (Pimm and Lawton 1977). • There could be longer food chains, but area in each of earth’s ecosystems is too small to support another trophic level.
Productivity pyramid: Tertiary consumers Secondary consumers Primary consumers Primary producers (plants) On average, a consecutive trophic level has only 10-20% of the biomass growth (often quantified as biomass-C) of the previous level.
Productivity Biomass Species (excluding plants and parasites) (Aquatic Ecosystems) (Terrestrial Ecosystems)
More productive ecosystems do not have longer food chains! Mean net primary productivity: 5-100 g m-2 yr-1 Mean net primary productivity: 1200 g m-2 yr-1
But, some low productivity biomes do have shorter food chains. Mean net primary productivity: 10 - 400 g m-2 yr-1
Why are so many food chains short? • Some low productivity food chains run out of energy to support higher trophic levels, but high productivity food chains that could support more trophic levels do not.
Increasing tendency to return to equilibrium after perturbation Pimm and Lawton compared the stability of a large number of hypothetical food chains, all including four species, but differently arranged:
Increasing tendency to return to equilibrium after perturbation With omnivory and competition: However, each omnivorous trophic web was much less stable than its non-omnivorous counterpart
Why are so many food chains short? • Some low productivity food chains run out of energy to support higher trophic levels, but high productivity food chains that could support more trophic levels do not. • Long food chains are more unstable (Pimm and Lawton 1977). - perhaps, but the model is really too simple.
The limited area hypothesis: Tertiary consumers Secondary consumers Primary consumers Primary producers (plants) If we have more area at the bottom, we get more total primary production over a whole region and perhaps enough fuel to sustain one more trophic level at the top.
Larger areas contain more species. (Unpublished data from Jake Vander Zanden for lakes in Canada)
Species diversity usually declines with increasing trophic levels. Schoenly et al. 1991
Why are so many food chains short? • Some low productivity food chains run out of energy to support higher trophic levels, but high productivity food chains that could support more trophic levels do not. • Long food chains are more unstable (Pimm and Lawton 1977). • - perhaps, but the model is really too simple. • Long food chains (> 4 trophic levels) do seem to require a larger ecosystem (larger area for terrestrial, greater volume for aquatic). - whether larger areas would allow longer trophic chains is untestable on this earth.
Summary • Food chains and webs are generally very complex, such that many species are weakly interacting either directly (through a feeding relationship) or indirectly (through feeding relationships once or twice removed). • This implies that the removal of one species can have many trickle-down effects in the food web. • Some species are more important than others: top predators and other key stone species. Their removal can lead to the loss of an entire community. • There appear to be strong limits on trophic chain length but we don’t know why. • In theory food chains could be longer but in practice they seldom are. Do higher trophic levels run out of energy or do they become too unstable?